Email Marketing Funnel Breakdown
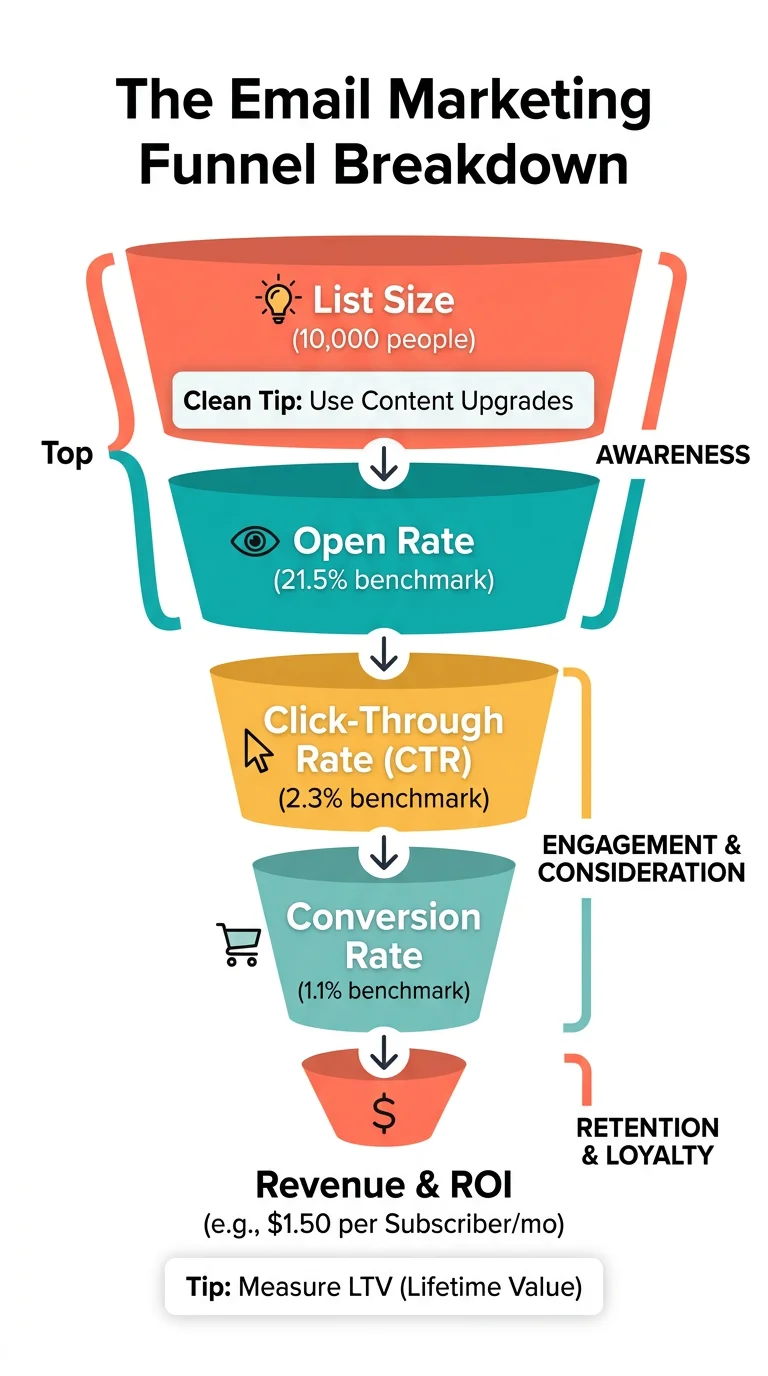
Visual funnel showing email campaign performance from list size to opens, clicks, conversions, and revenue with benchmarks at each stage
About this example
Visual funnel showing email campaign performance from list size to opens, clicks, conversions, and revenue with benchmarks at each stage
Prompt Preview
Create a marketing infographic showing an email marketing funnel breakdown. Show a visual funnel with 5 stages from top to bottom: List Size, Open Rate, Click-Through Rate, Conversion Rate, and Revenue Per Email. At each stage show the typical benchmark percentage, the number of people remaining, and one actionable tip to improve that stage. Include a sidebar comparing B2B vs B2C email benchmarks. Add icons and visual elements that make the data flow clear. Use a vibrant modern marketing color palette with coral, teal, and warm yellow accents on a clean white background.
More Marketing Examples
View all
Social Media Content Calendar
Weekly content planning template showing post types, optimal timing, platform-specific formats, and a content mix ratio for consistent engagement
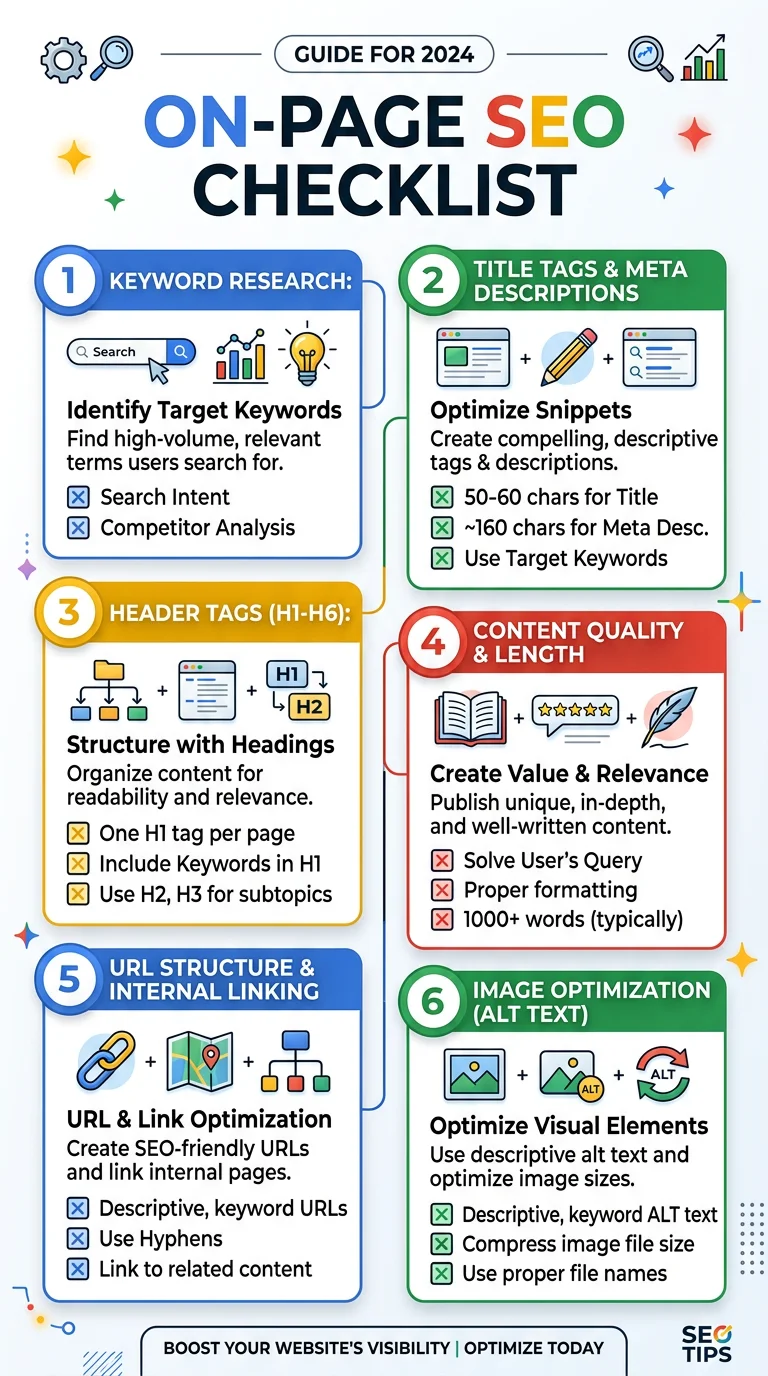
On-Page SEO Checklist
Complete checklist for optimizing web pages covering title tags, meta descriptions, headings, image alt text, internal links, and Core Web Vitals
Want to customize further?
Use this example as a base, then tweak the prompt, upload your own data, or add reference images for a fully custom result.
Generate from This Example