All Categories
Business Infographics
Business infographics work best when the audience needs quick clarity on strategy, performance, pricing, or market context. This category is strongest for executive summaries, quarterly reporting, and customer-facing comparison material.
Common patterns in this category
- Quarterly metrics and KPI snapshots
- Competitive positioning and pricing comparisons
- Market landscape and benchmark summaries
Best infographic types
Selected examples
Guided starters that fit this category especially well.
Business
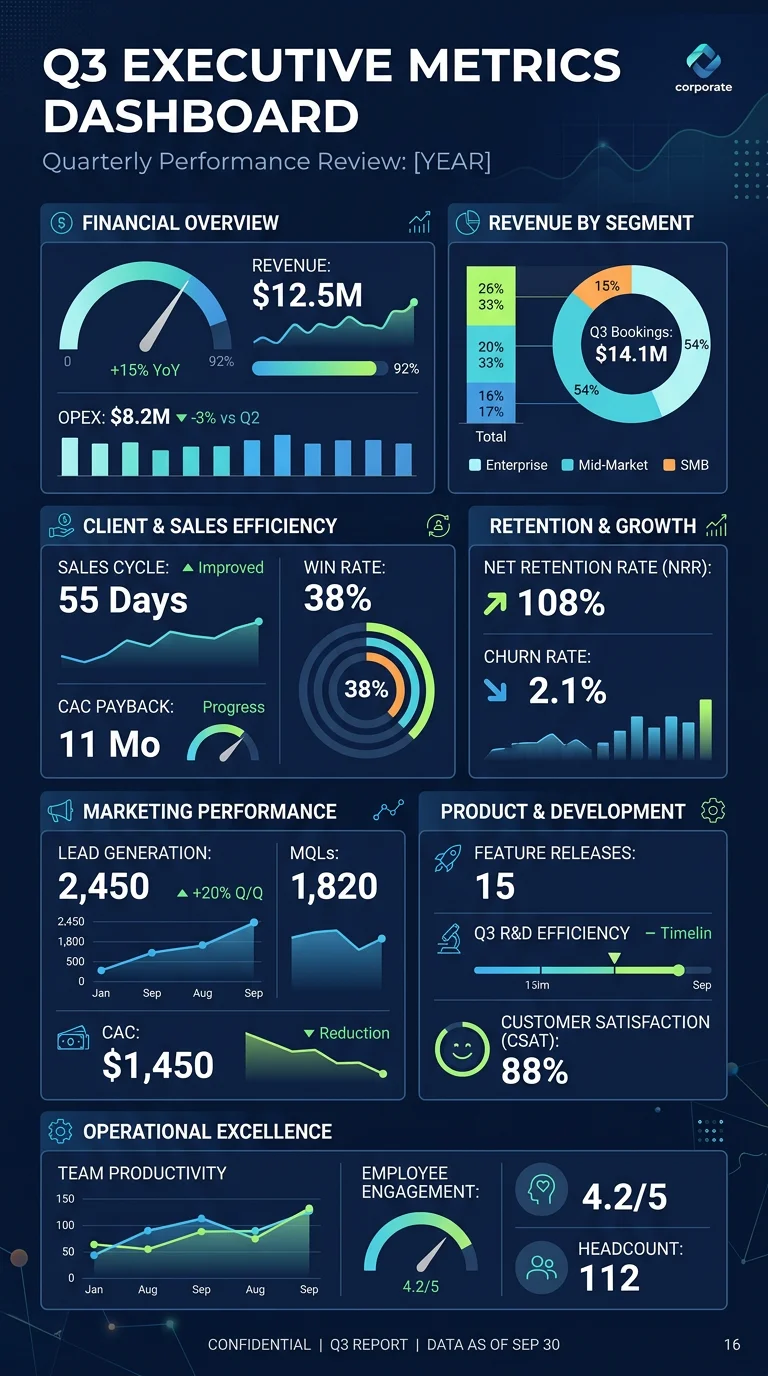
Quarterly Business Metrics Dashboard
Executive summary template showing revenue, growth rate, customer acquisition cost, churn, and net promoter score with quarter-over-quarter trends
Business
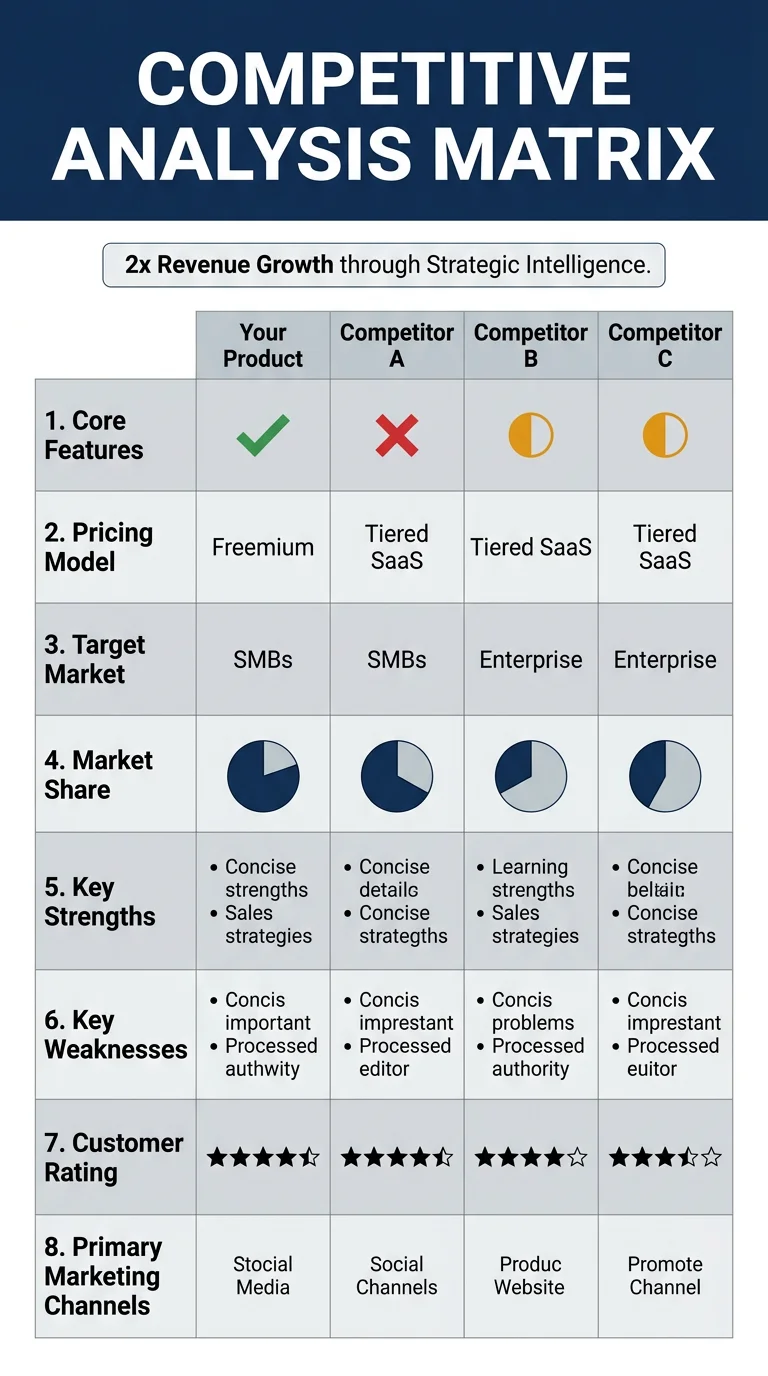
Competitive Analysis Matrix
Template for comparing your product against 3 competitors across features, pricing, market position, strengths, and weaknesses
Business
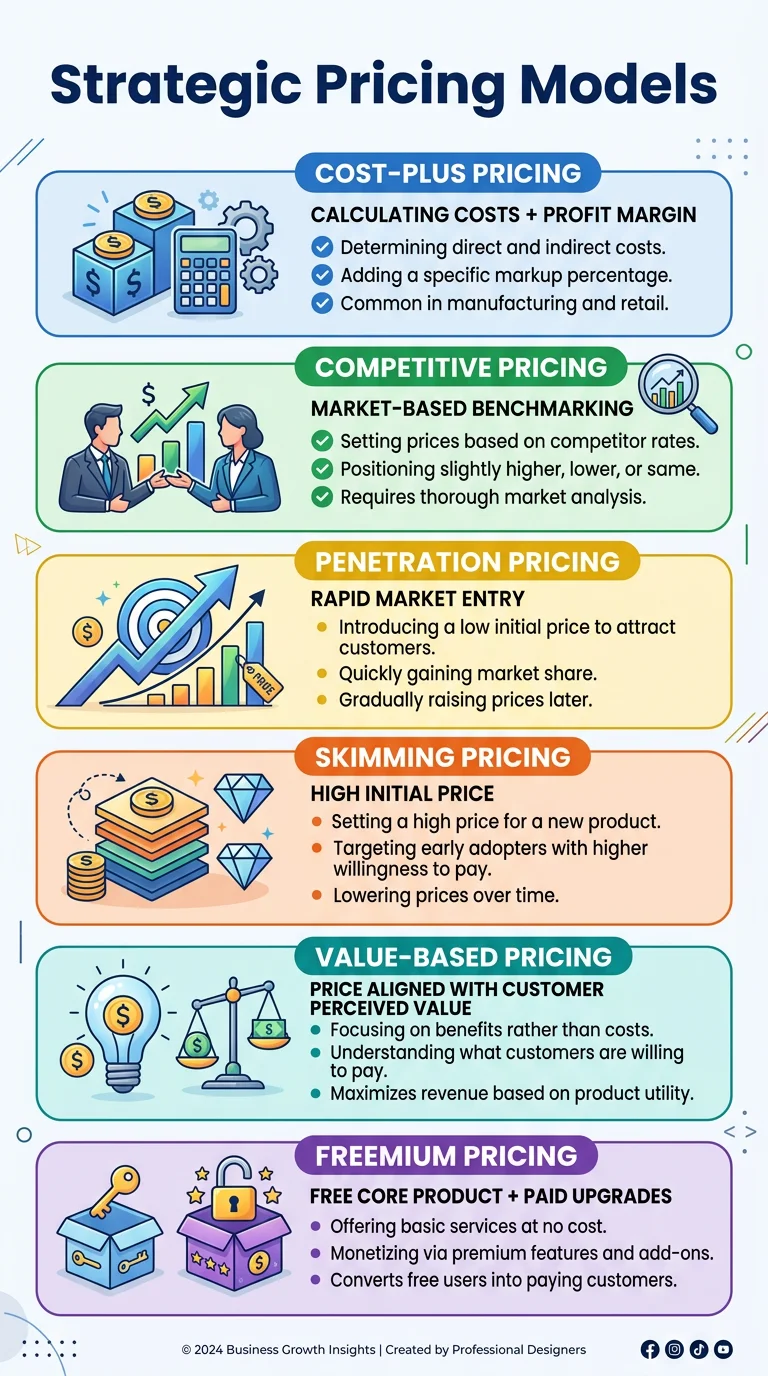
Pricing Strategy Models
Comparison of 6 common pricing strategies including cost-plus, value-based, competitive, freemium, penetration, and skimming with when to use each