Infographics
Browse real examples first, then narrow in by category or format when you know the job more clearly.
Browse by category
View category hubInfographic examples
Start from an example, then customize the prompt, data, and final output.
30 examples
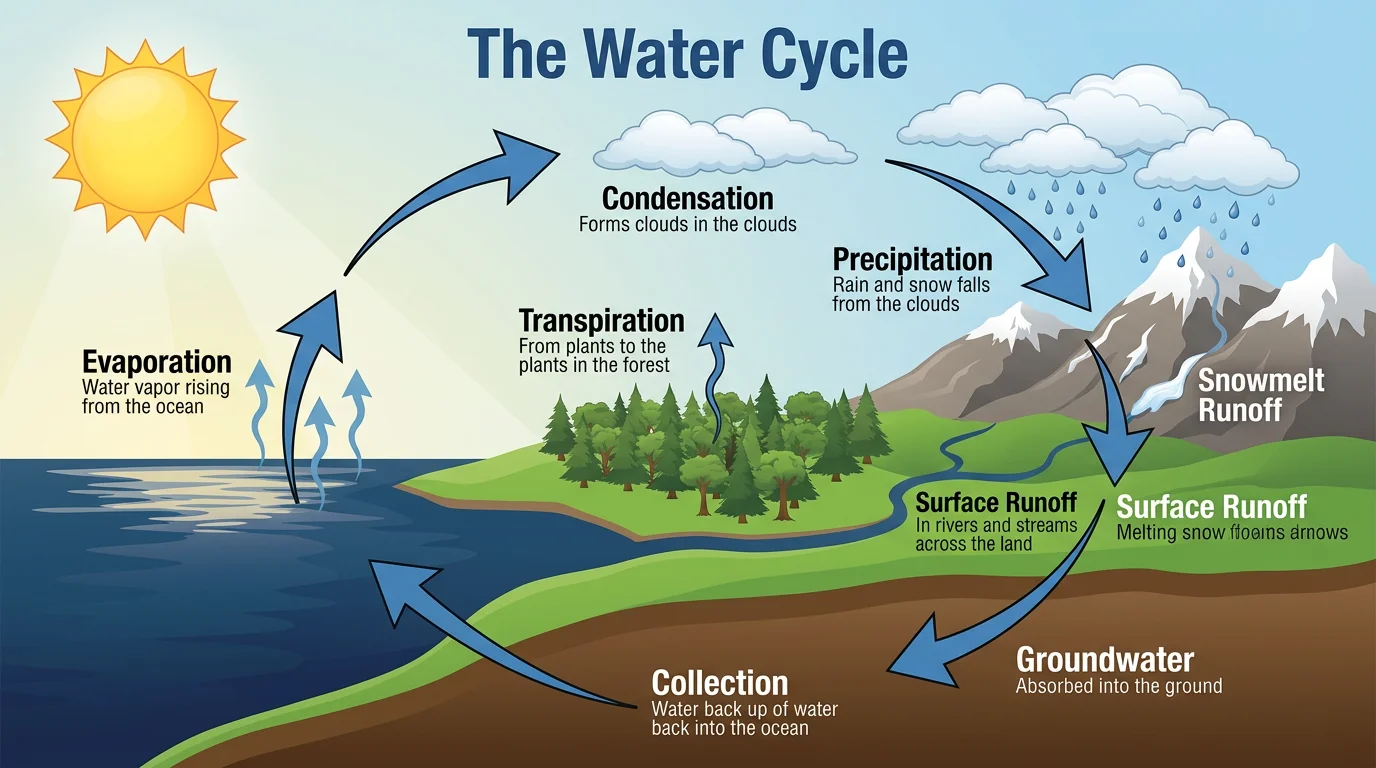
The Water Cycle Explained
Complete visual guide to Earth's water cycle showing evaporation, condensation, precipitation, runoff, and collection with key freshwater facts
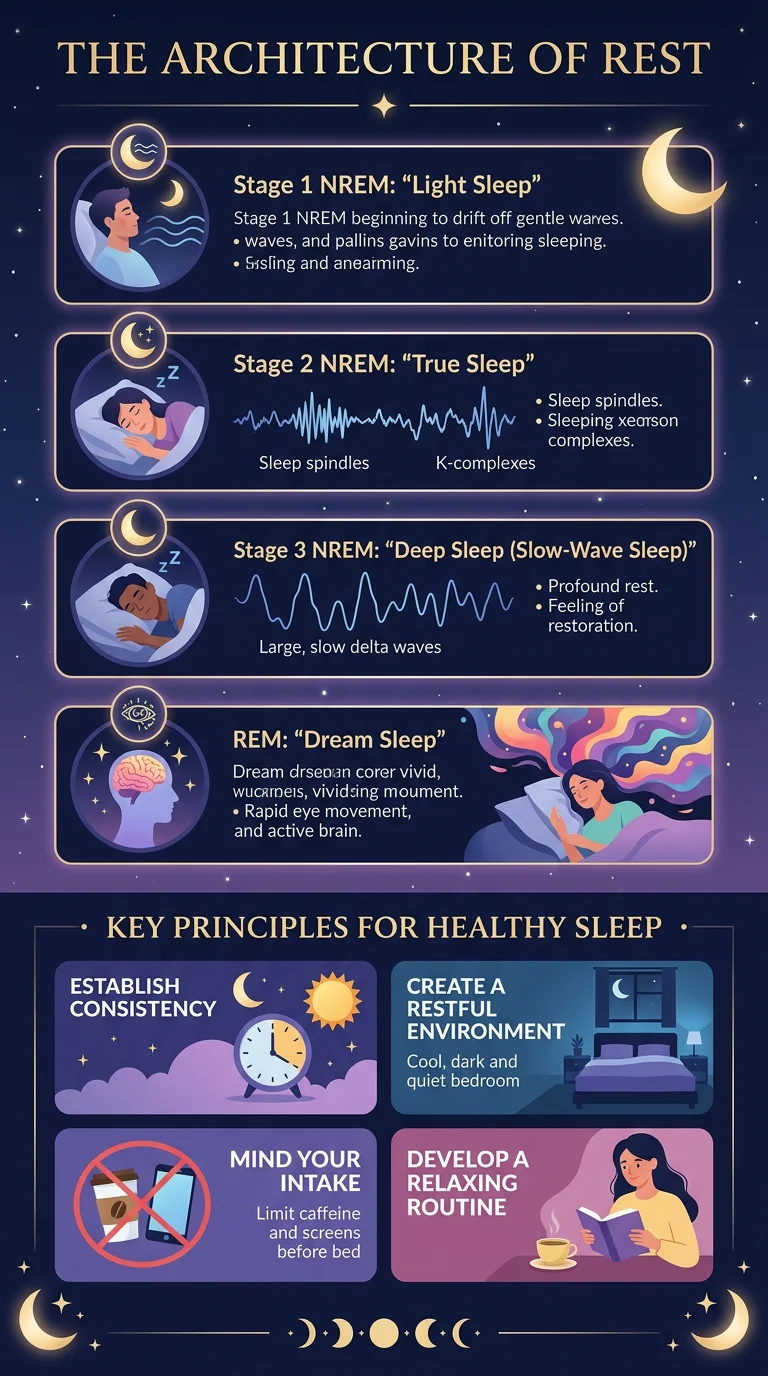
Understanding Sleep Stages
Visual breakdown of the 4 sleep stages including NREM light, NREM deep, and REM sleep with duration percentages and tips for better rest
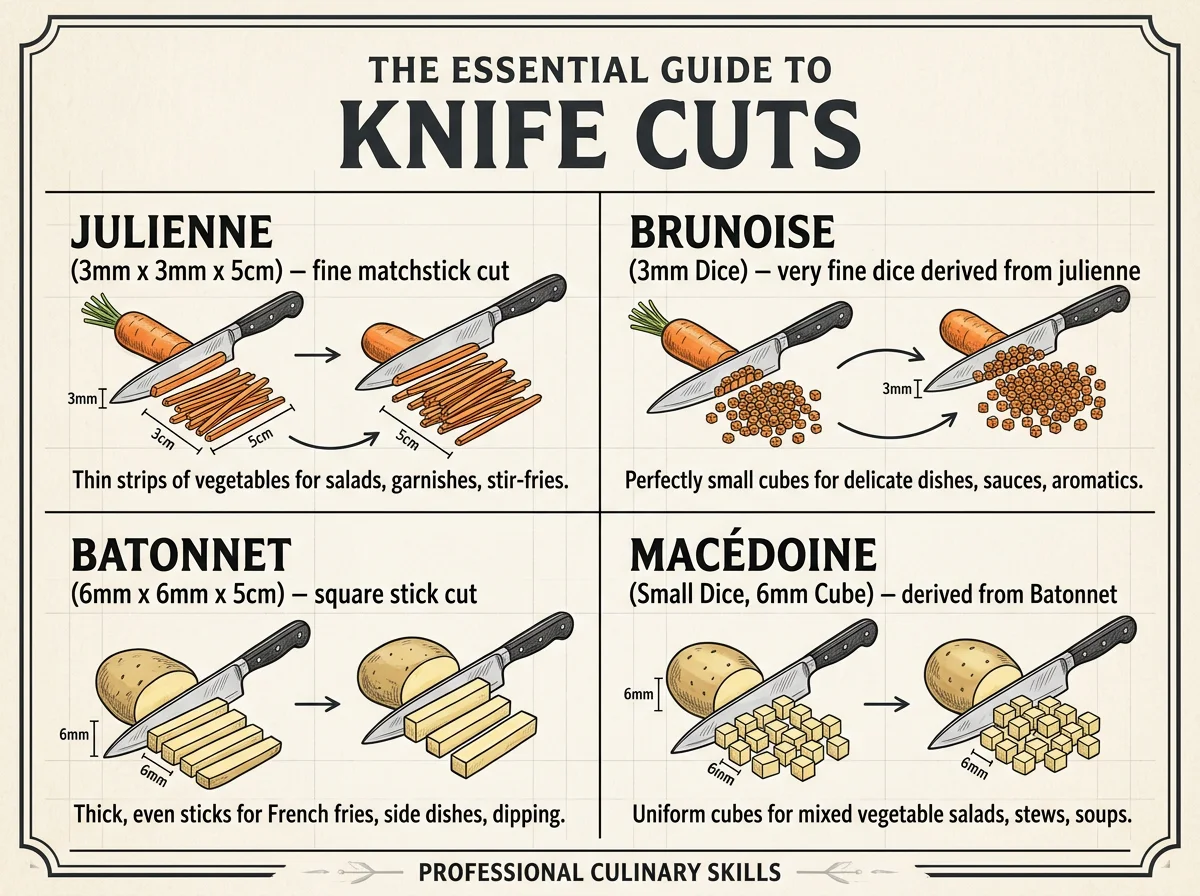
Kitchen Knife Cuts Reference
Visual guide to essential knife cuts including brunoise, dice, julienne, chiffonade, and mince with measurements and best uses
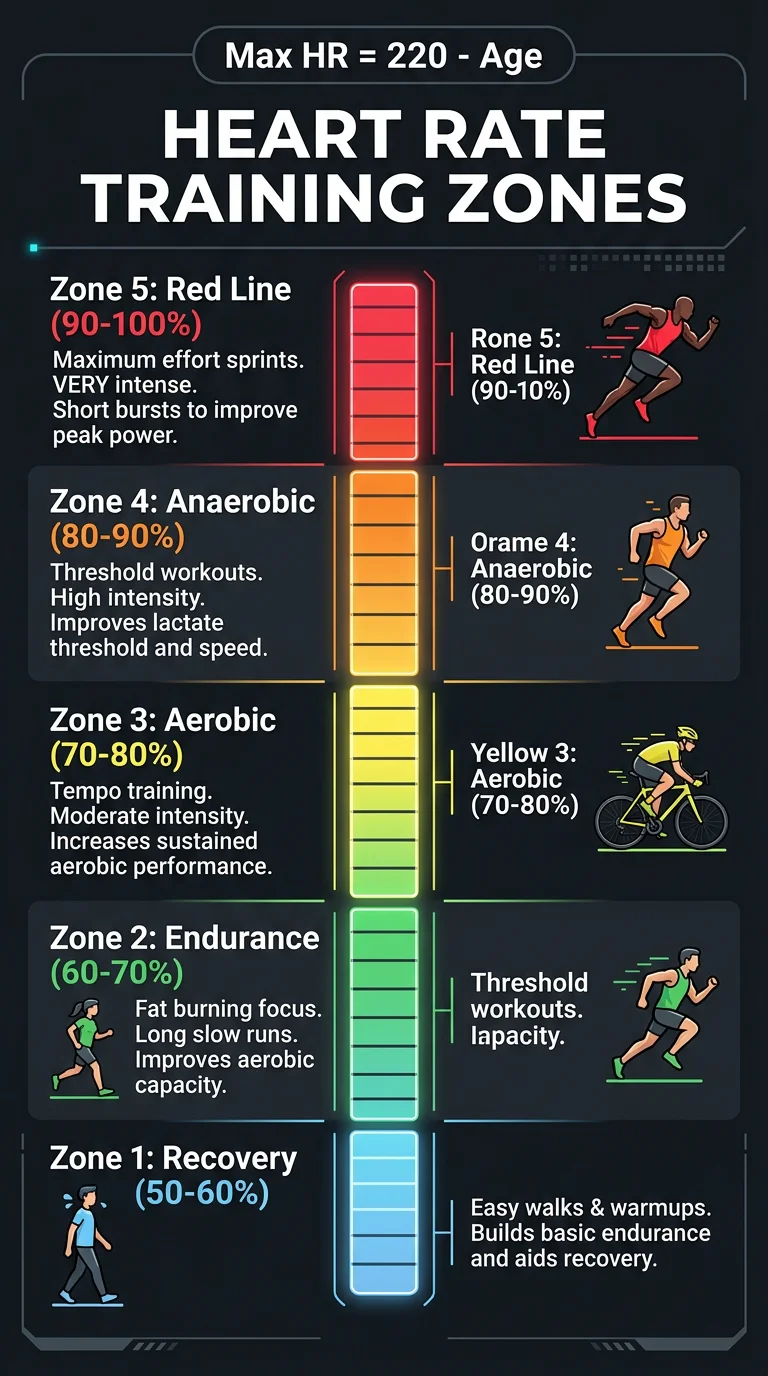
Heart Rate Training Zones
Visual guide to 5 heart rate zones for runners and cyclists with target percentages, example workouts, and how to calculate your max HR
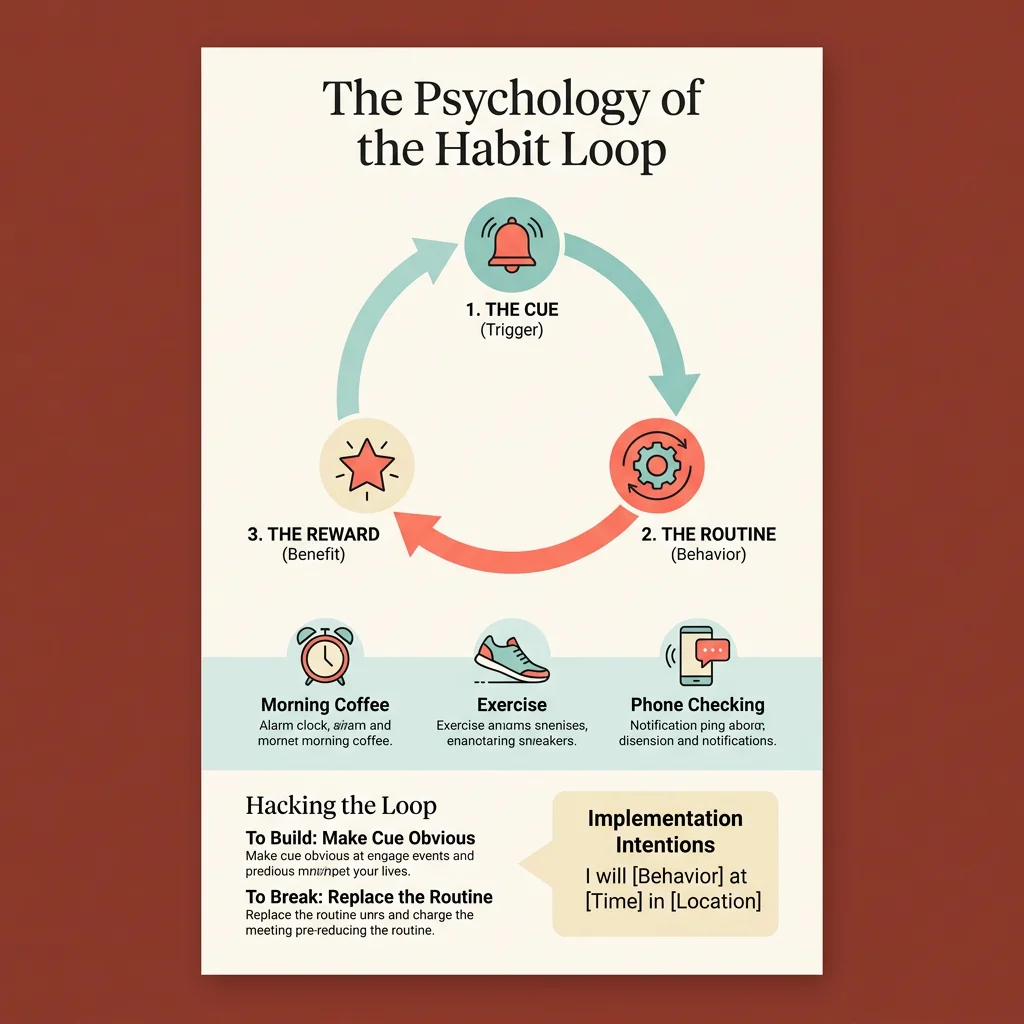
The Habit Loop Explained
Behavioral psychology diagram of the cue-routine-reward loop with real-world examples and strategies for building good habits
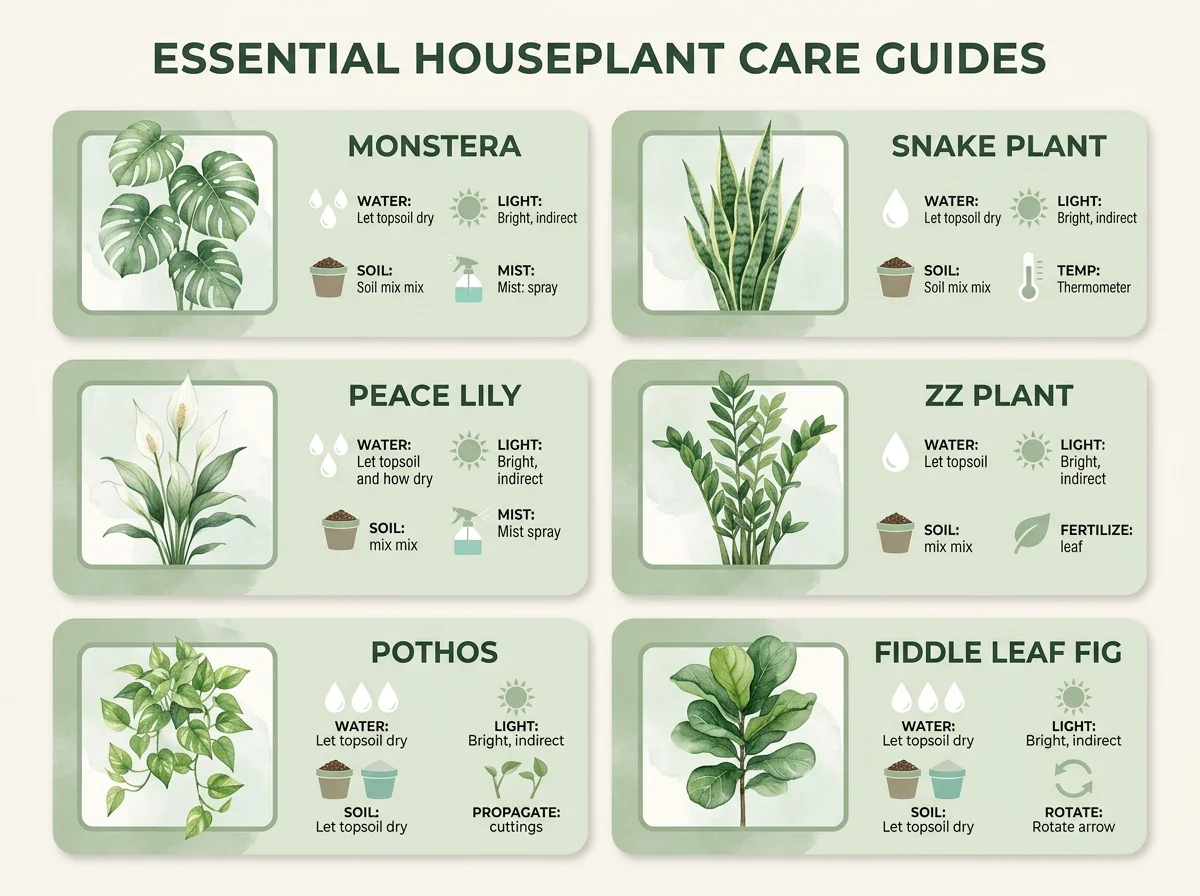
Houseplant Care Guide
Care cards for 6 popular indoor plants covering light needs, watering frequency, difficulty rating, and essential care tips
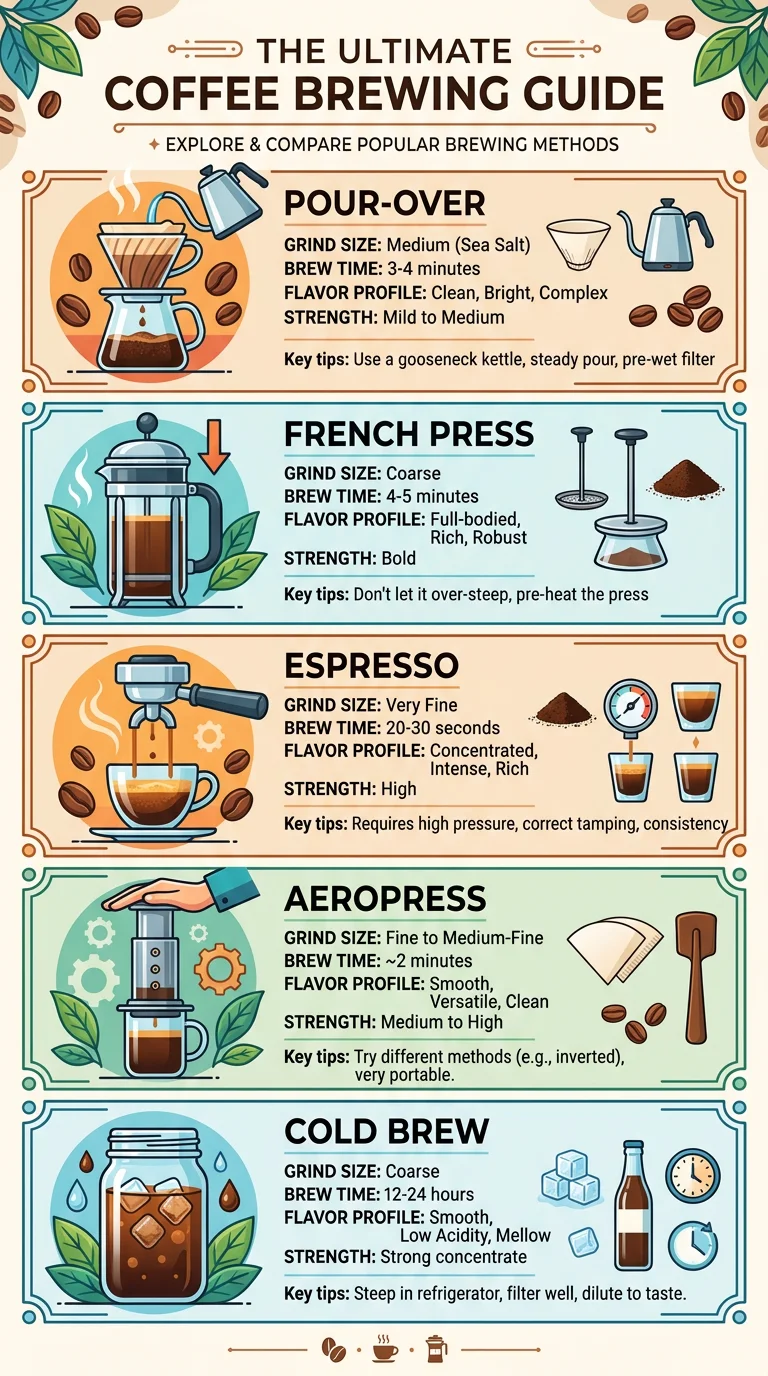
Coffee Brewing Methods Compared
Side-by-side comparison of pour-over, French press, espresso, AeroPress, and cold brew with brew times, grind sizes, flavor profiles, and a decision tree to find your perfect method
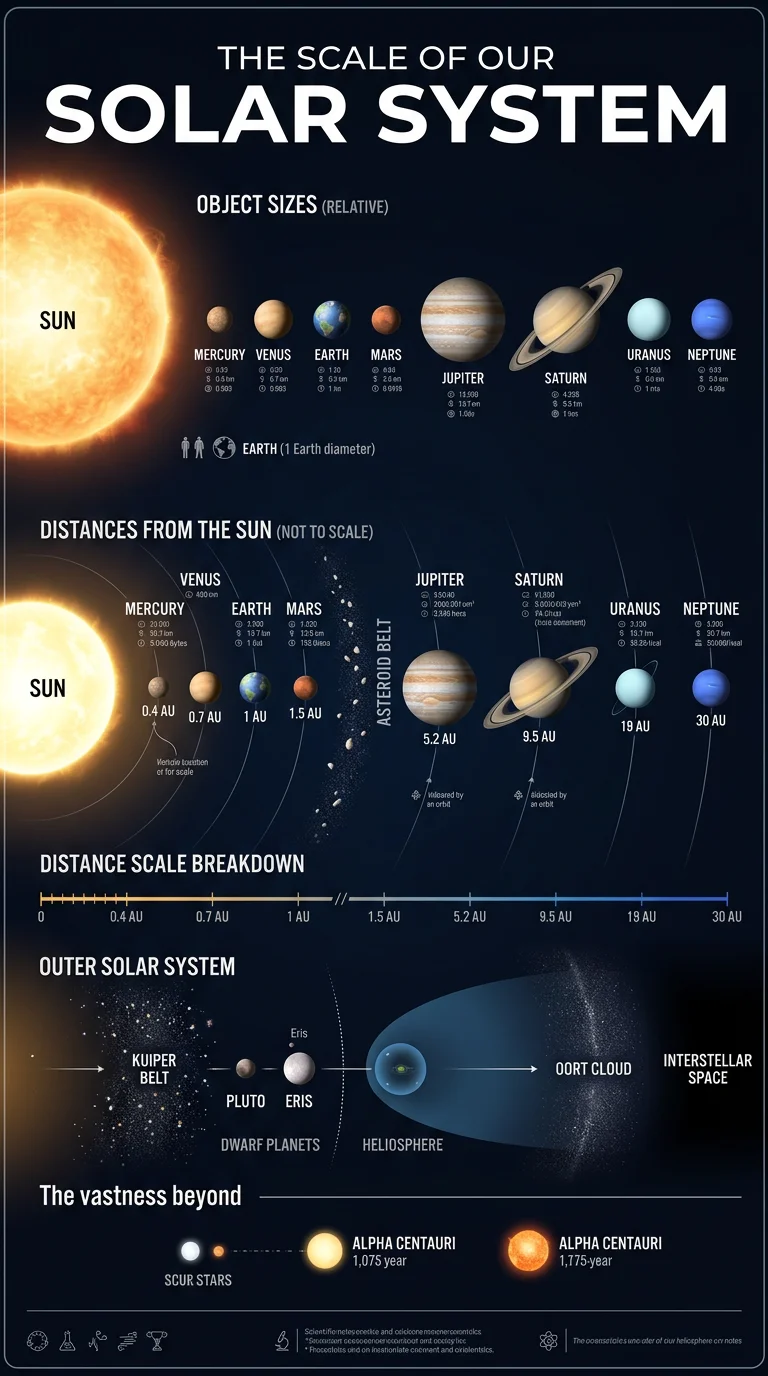
Solar System Scale Cheat Sheet
All 8 planets with relative sizes, distances, orbital periods, fun facts, and size comparisons between Earth, Jupiter, and the Sun
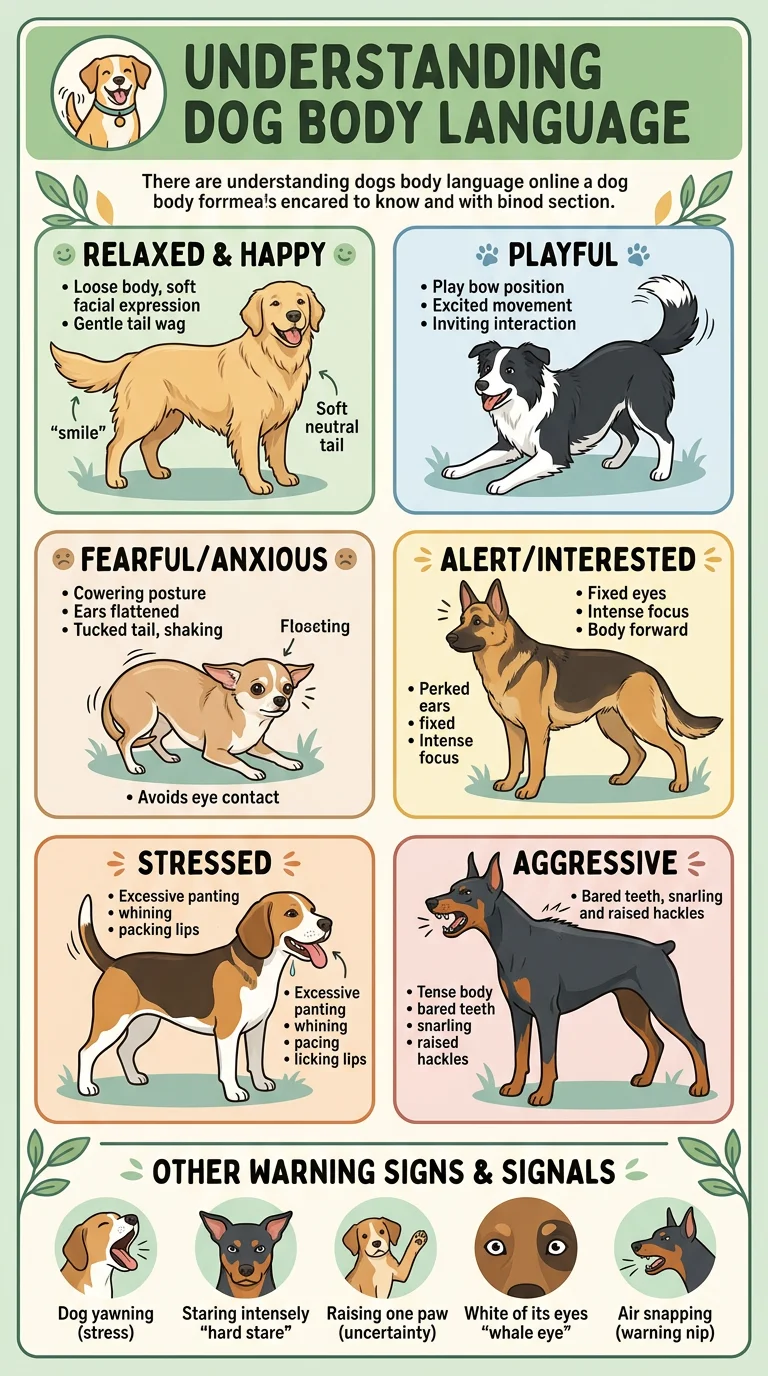
Understanding Dog Body Language
Visual guide to 6 canine emotional states with body signals, appropriate human responses, and myth-busting common misconceptions about dog behavior
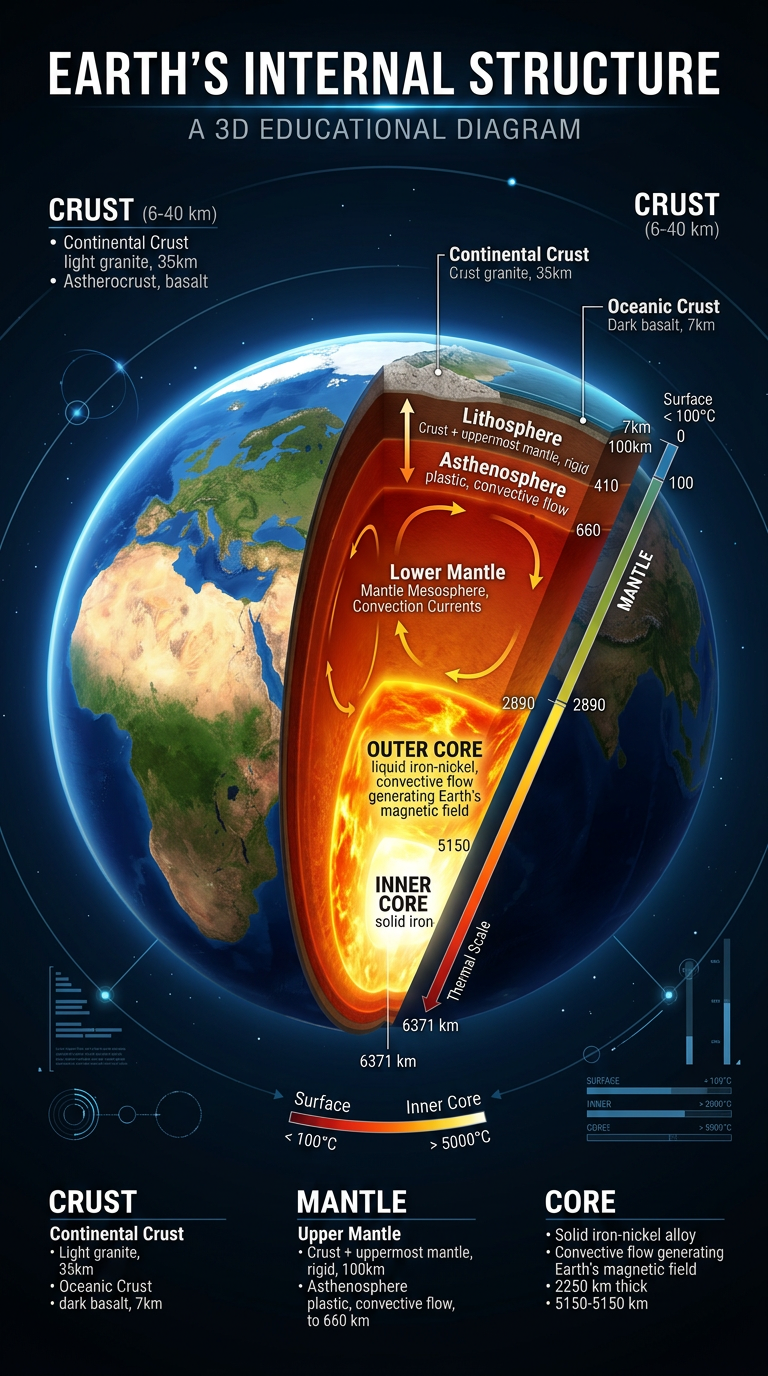
Layers of the Earth
Cross-section diagram showing Earth's crust, mantle, outer core, and inner core with thickness, temperature, composition, and state of matter for each layer
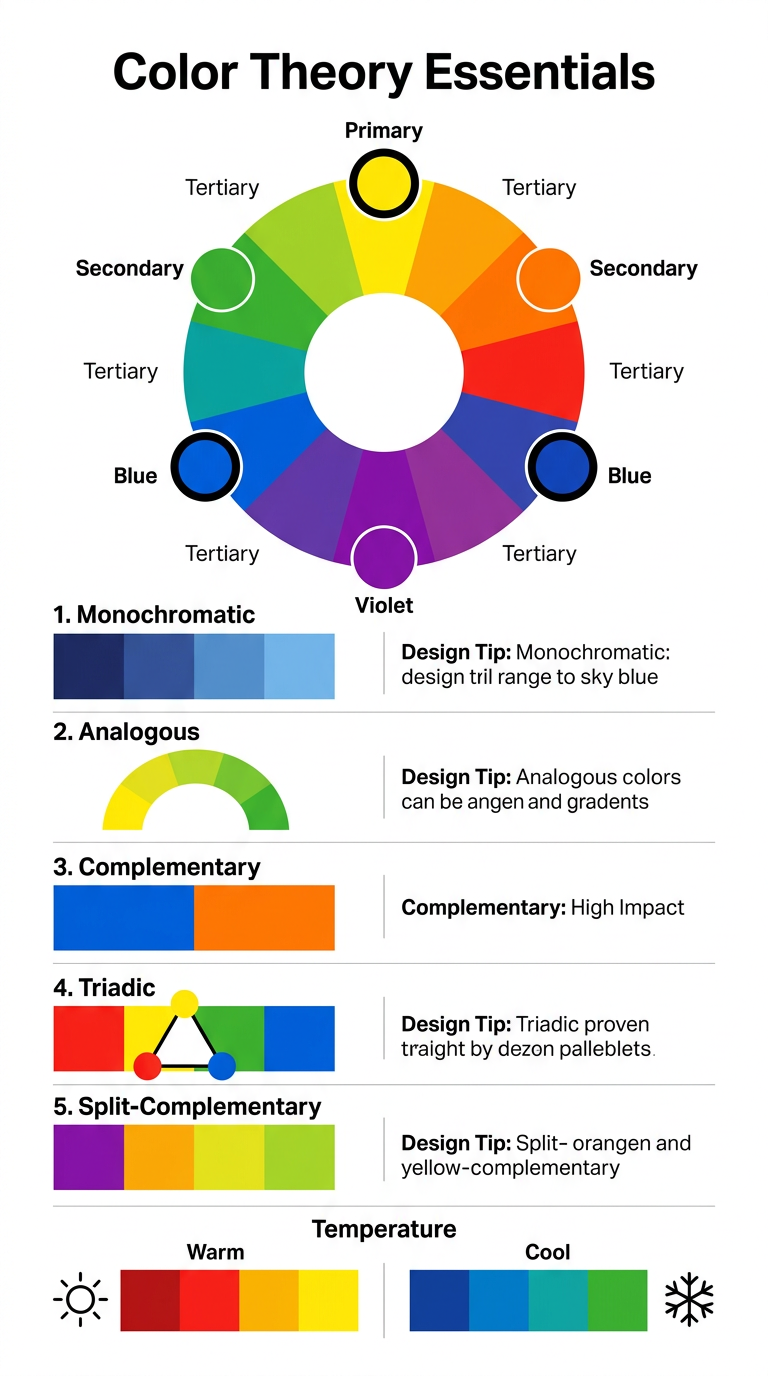
Color Wheel & Harmony Guide
Complete color theory reference showing the color wheel with primary, secondary, and tertiary colors plus complementary, analogous, triadic, and split-complementary harmony schemes
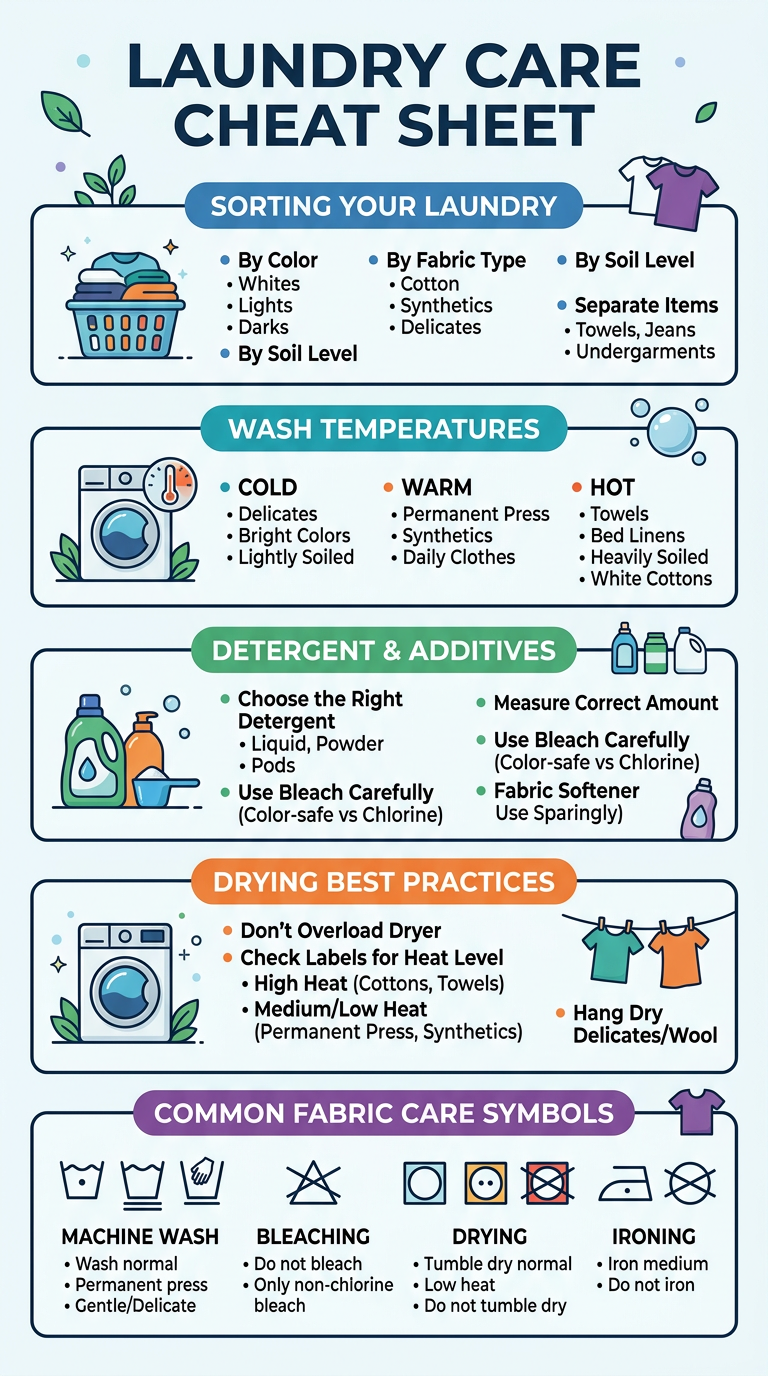
Laundry Symbols Decoded
Visual cheat sheet explaining all common laundry care symbols for washing, bleaching, drying, ironing, and dry cleaning with plain-English meanings
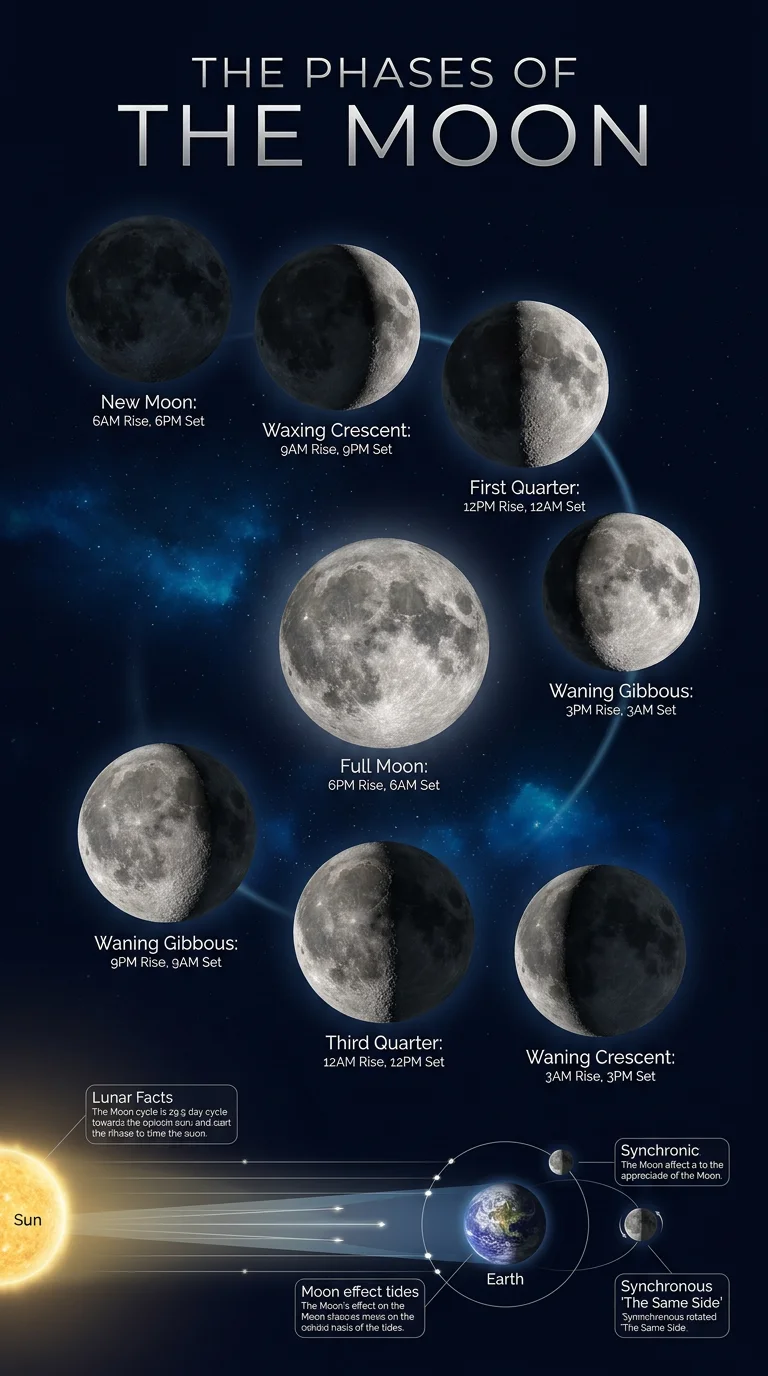
Moon Phases Explained
Visual timeline of the 8 lunar phases over a month showing waxing and waning stages with illumination percentages, rise and set times, and key astronomy facts
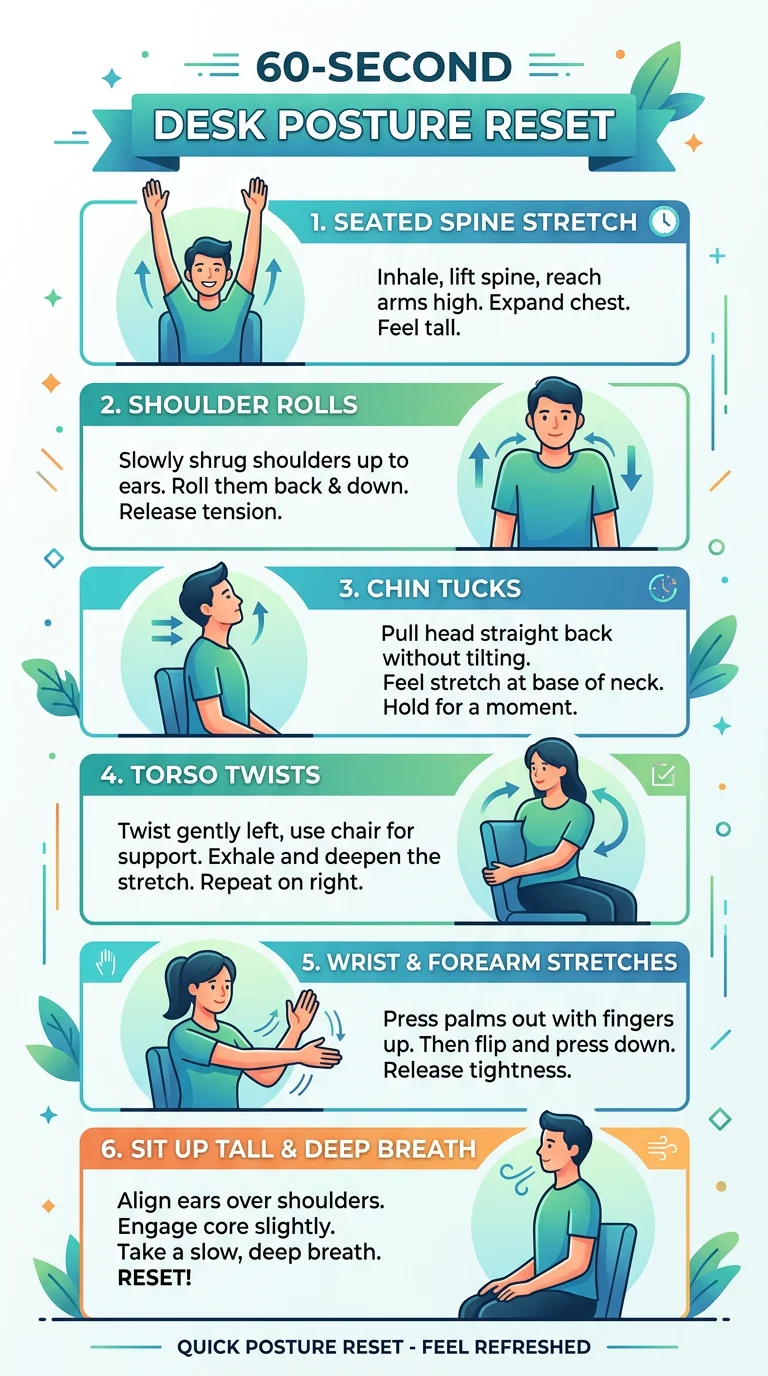
60-Second Desk Posture Reset
Quick illustrated sequence of 5 stretches and posture corrections you can do at your desk to relieve neck, shoulder, and lower back tension
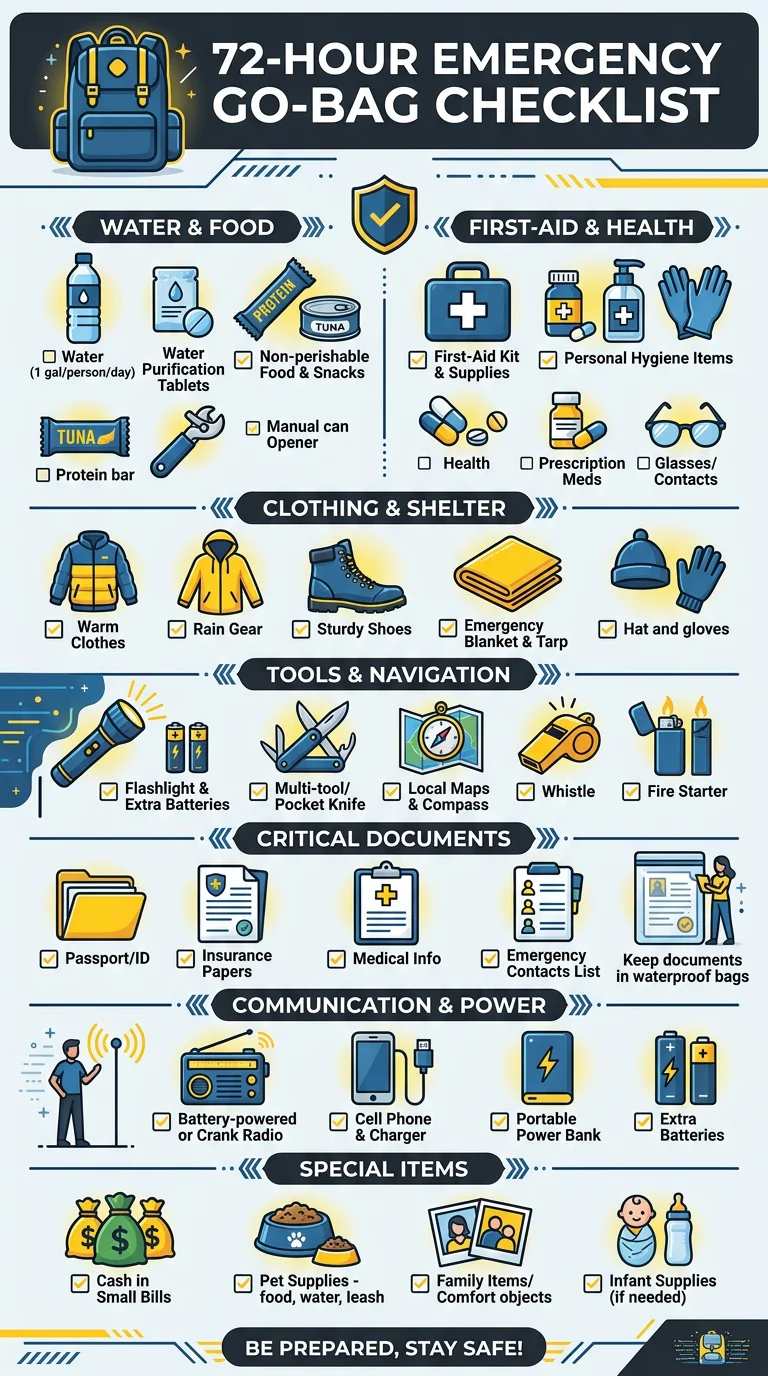
Emergency Go-Bag Checklist
Complete categorized checklist for building a 72-hour emergency go-bag with water, food, documents, first aid, tools, and personal items
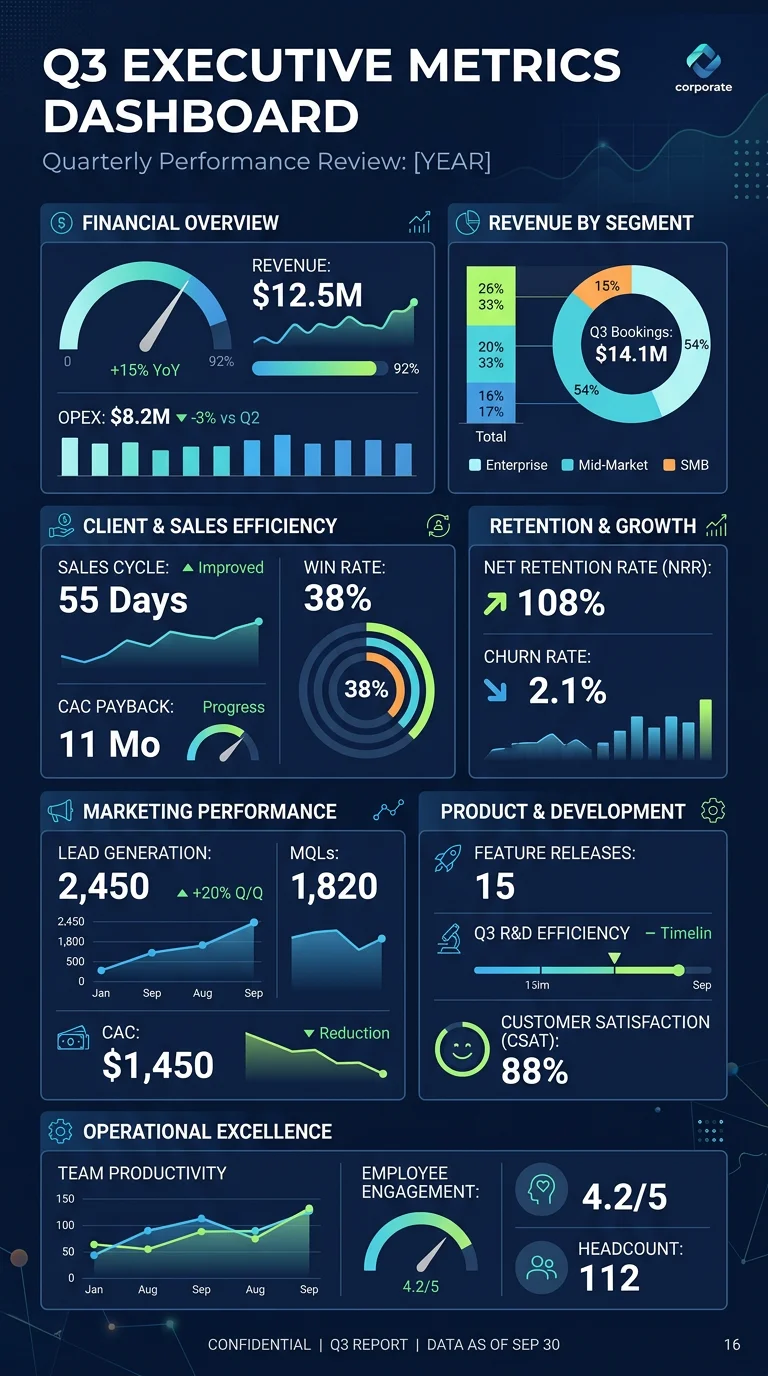
Quarterly Business Metrics Dashboard
Executive summary template showing revenue, growth rate, customer acquisition cost, churn, and net promoter score with quarter-over-quarter trends
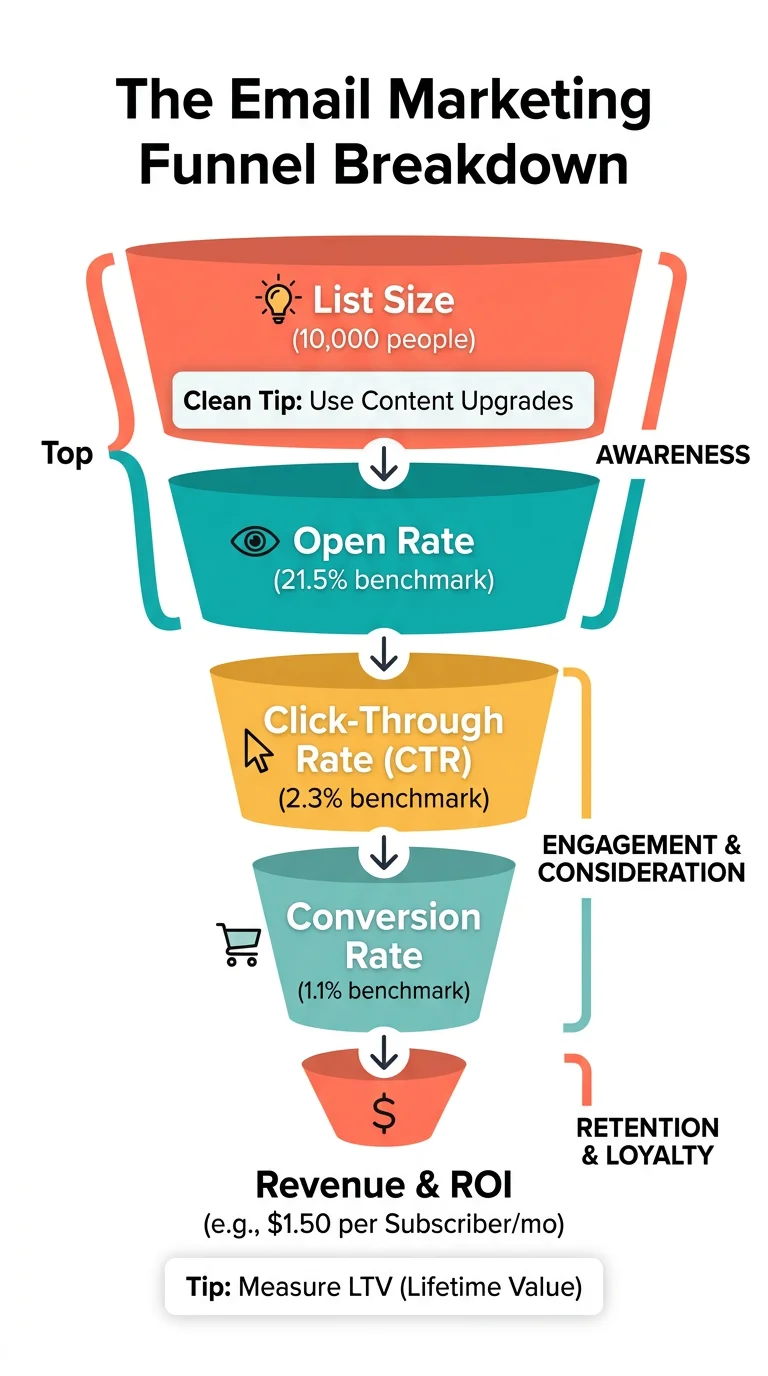
Email Marketing Funnel Breakdown
Visual funnel showing email campaign performance from list size to opens, clicks, conversions, and revenue with benchmarks at each stage
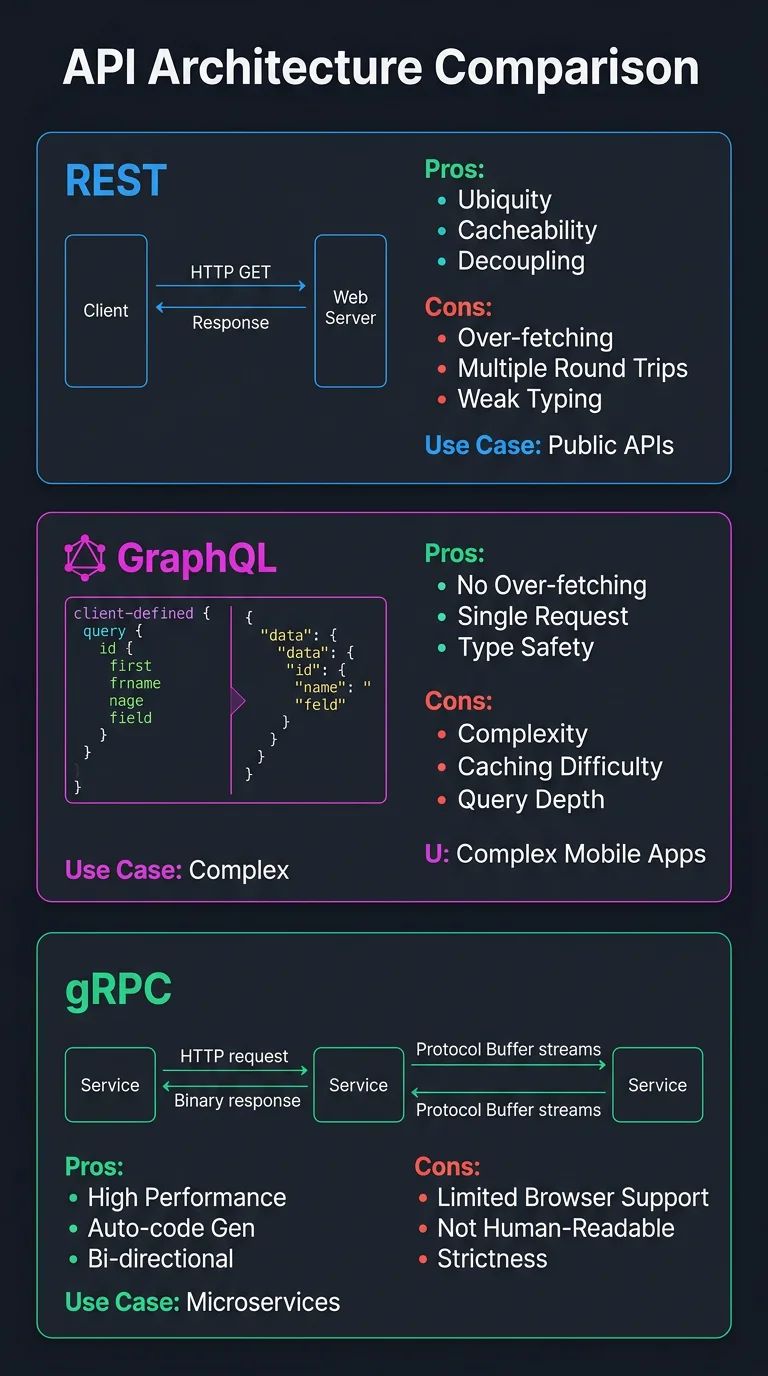
API Architecture Patterns Compared
Side-by-side comparison of REST, GraphQL, gRPC, and WebSocket APIs with use cases, pros and cons, and a decision guide
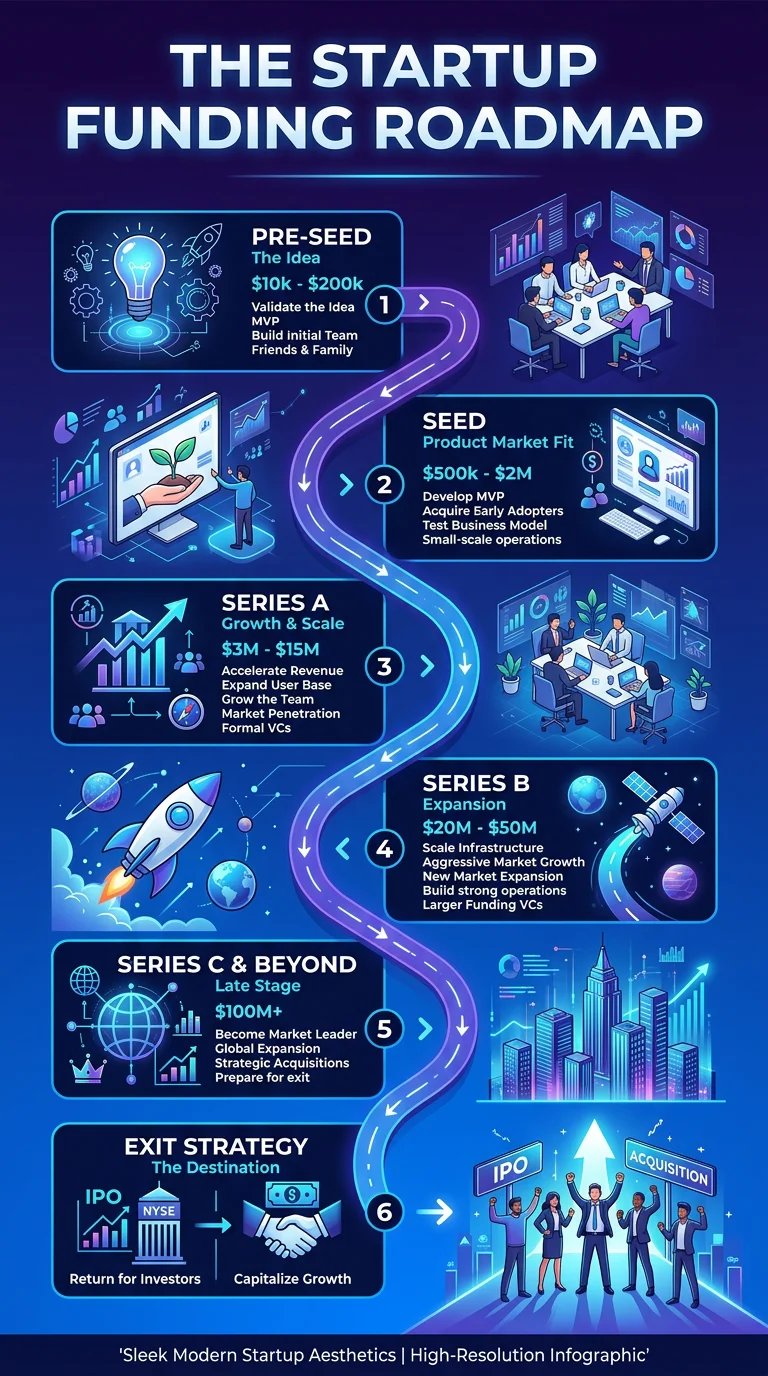
Startup Funding Stages Explained
Visual roadmap from pre-seed to IPO showing typical funding amounts, equity dilution, investor types, and milestones expected at each stage
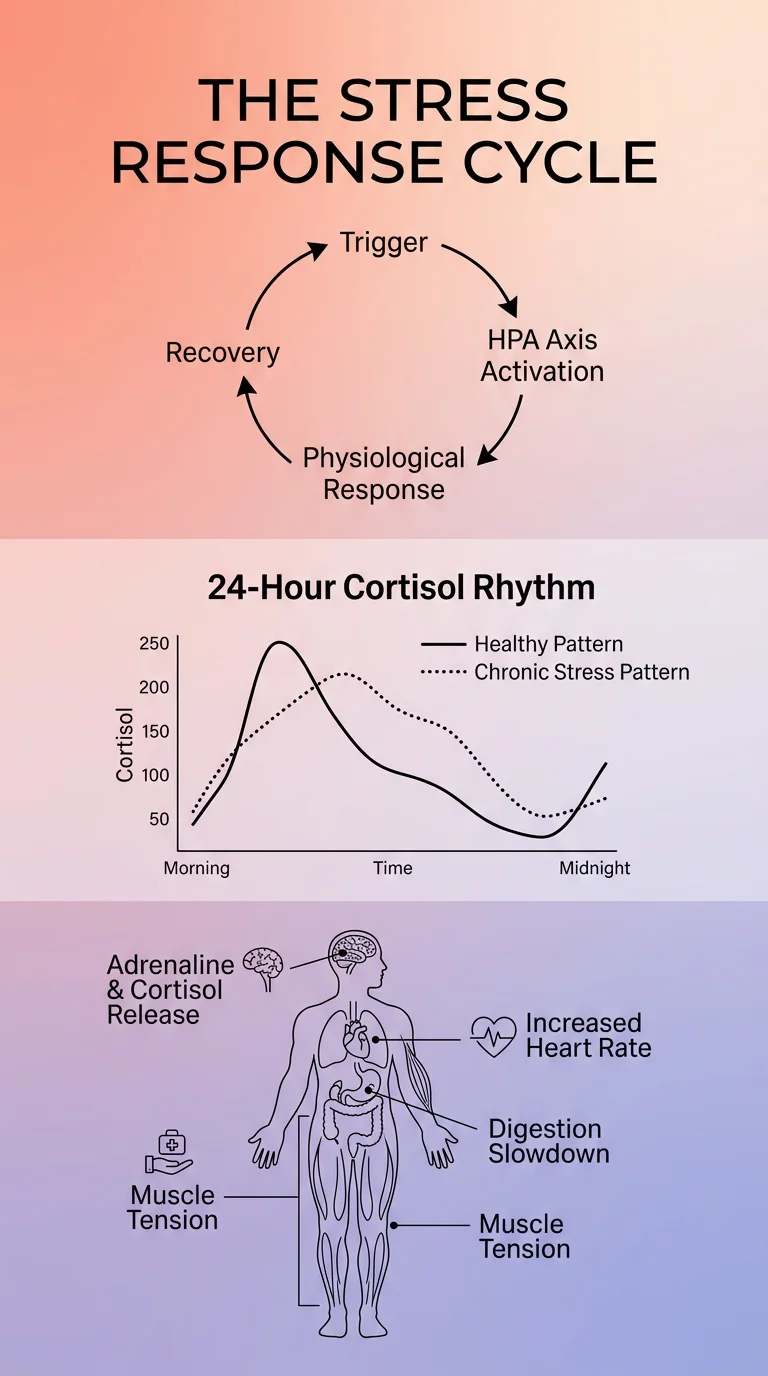
The Stress Response Cycle
Science-backed diagram of the stress cycle showing trigger, fight-or-flight response, cortisol timeline, and 6 evidence-based recovery strategies
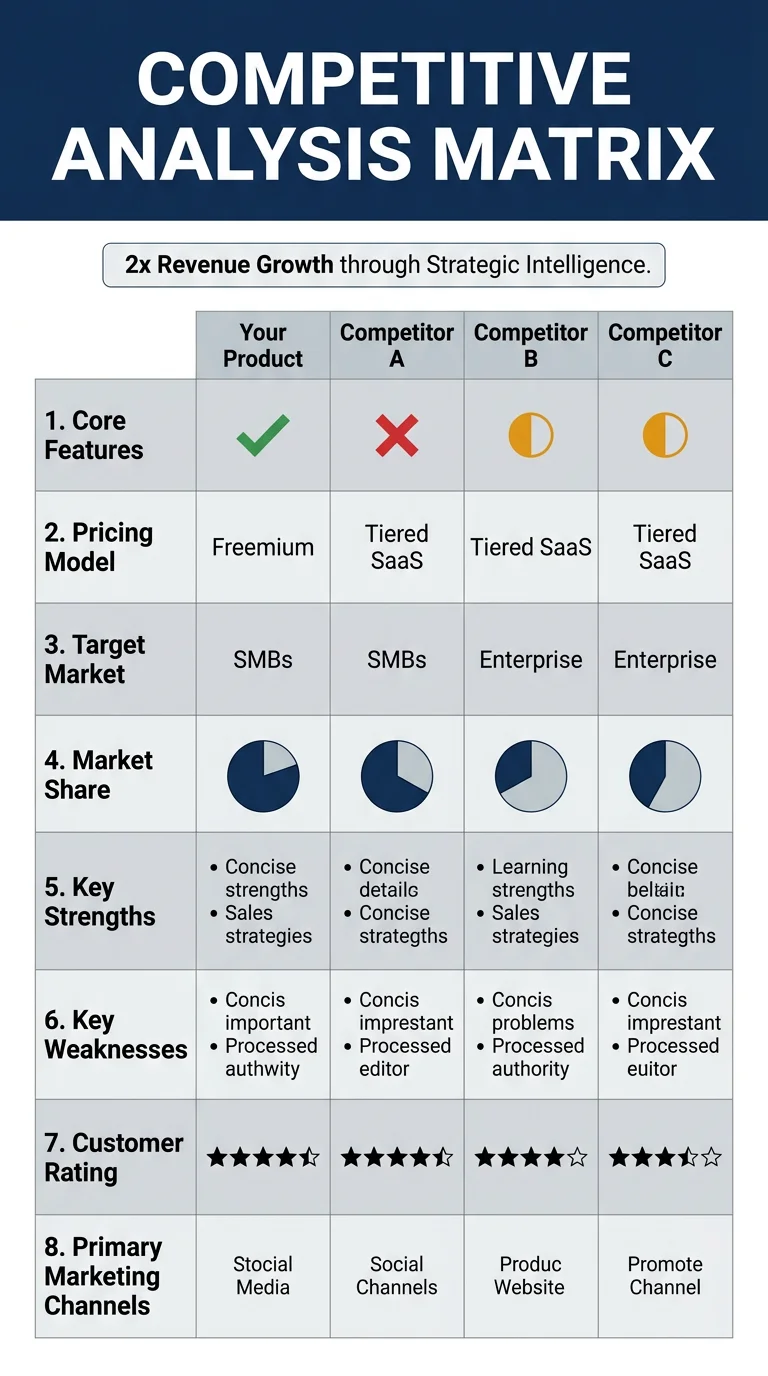
Competitive Analysis Matrix
Template for comparing your product against 3 competitors across features, pricing, market position, strengths, and weaknesses
Social Media Content Calendar
Weekly content planning template showing post types, optimal timing, platform-specific formats, and a content mix ratio for consistent engagement
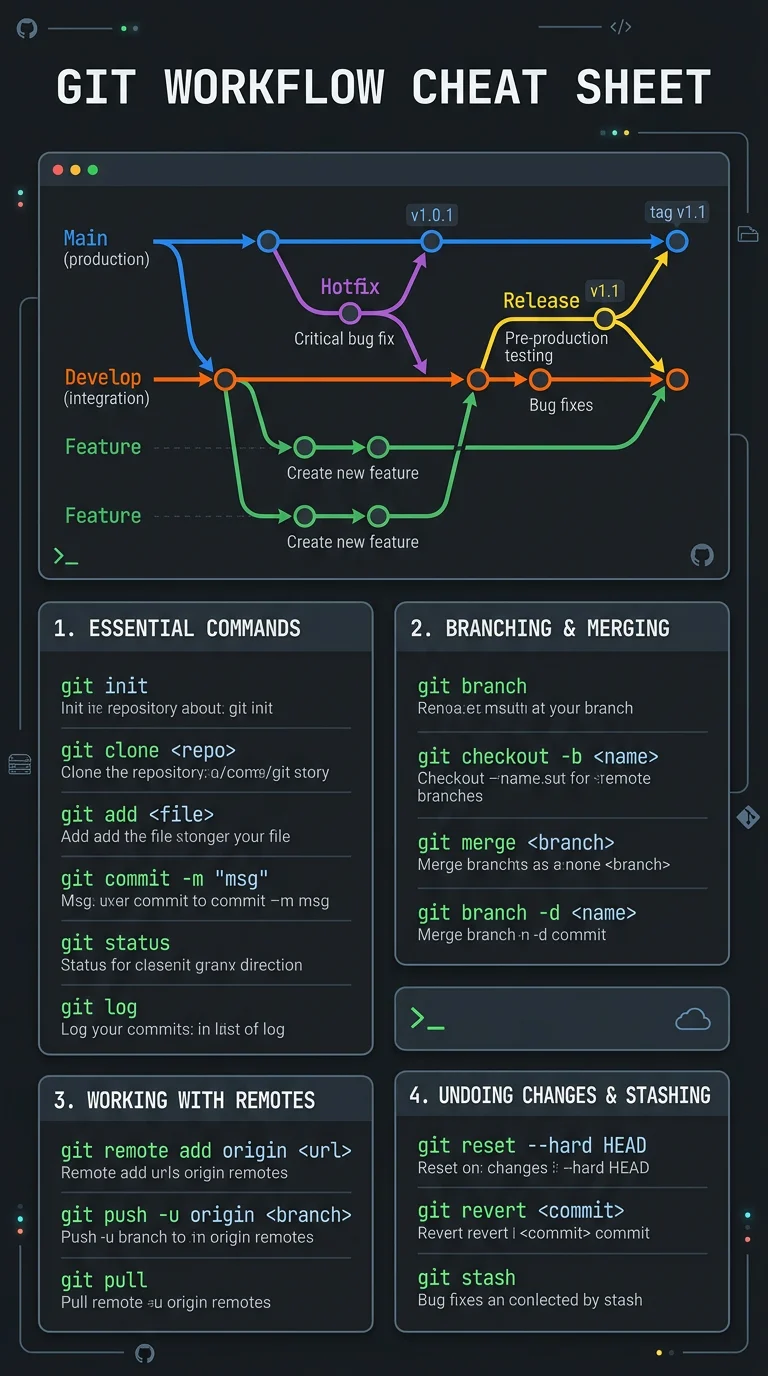
Git Workflow Cheat Sheet
Visual guide to Git branching strategies showing feature branches, pull requests, merge vs rebase, and common commands with examples
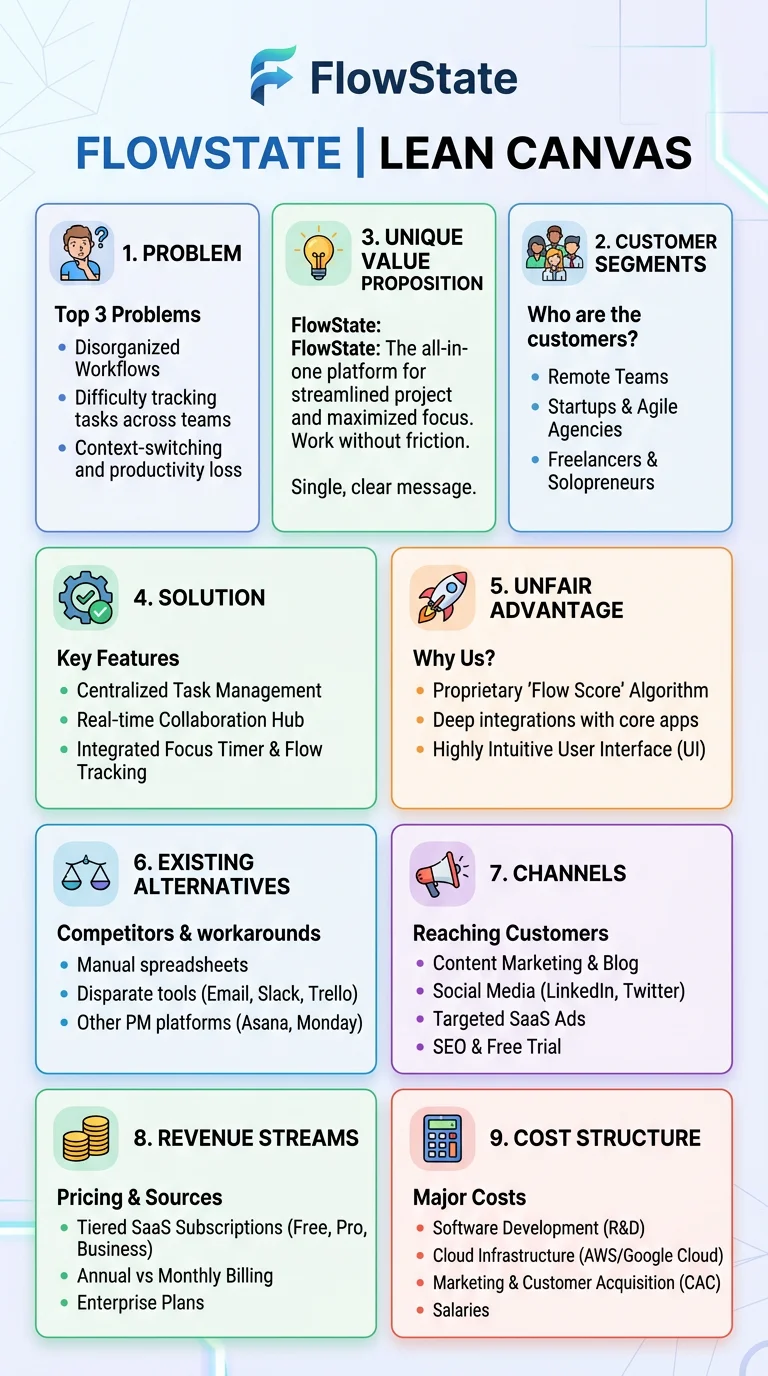
Lean Canvas One-Pager
Visual template of the Lean Canvas framework with all 9 blocks explained including problem, solution, key metrics, unfair advantage, and revenue streams
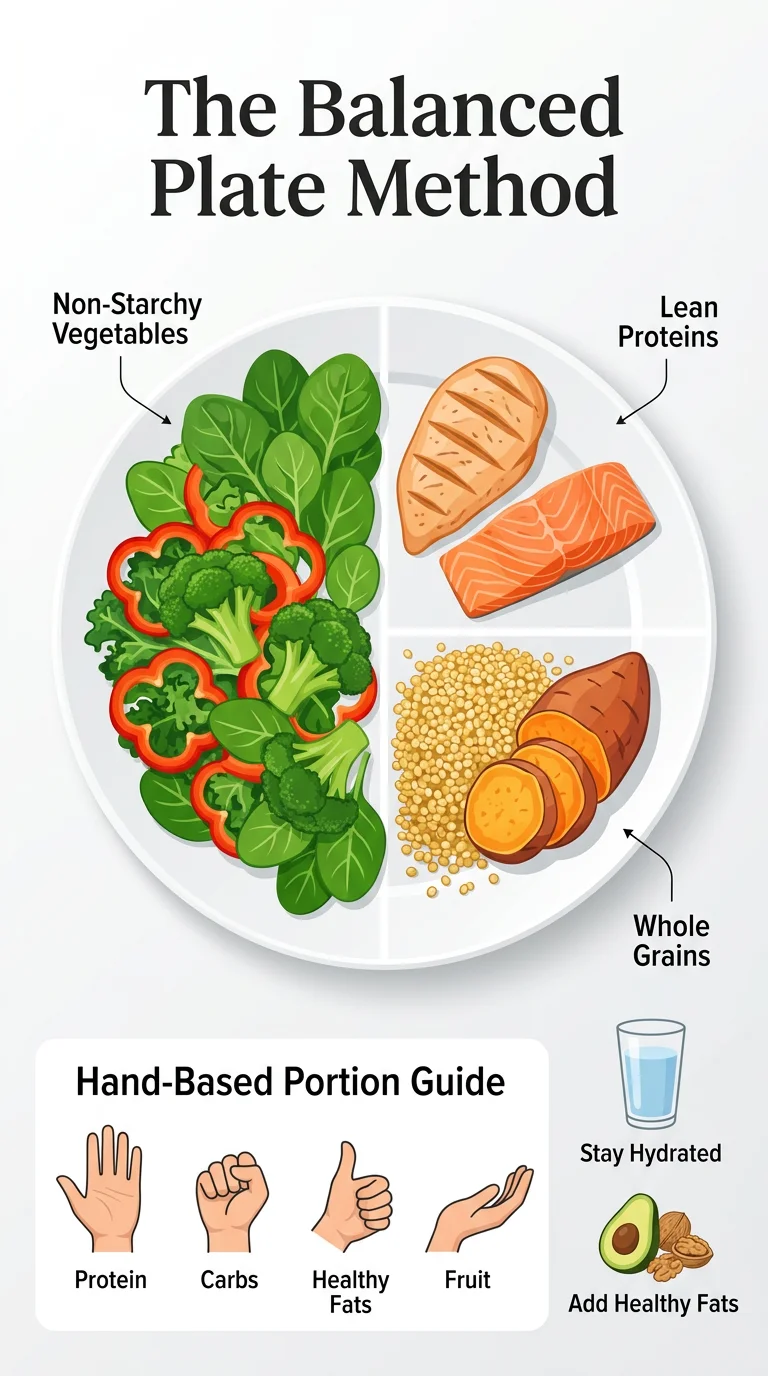
The Balanced Plate Method
Visual guide to building balanced meals using the plate method with half vegetables, quarter protein, quarter carbs, plus portion size examples
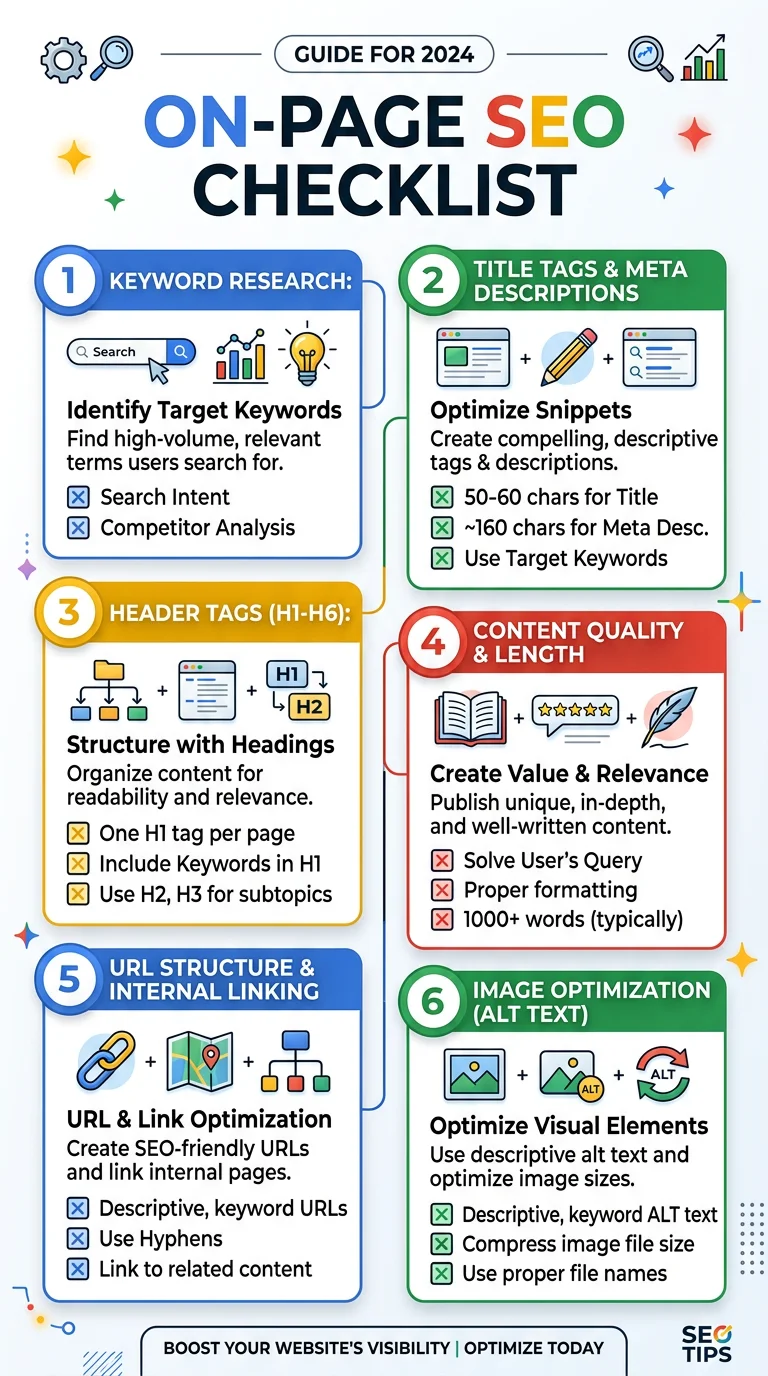
On-Page SEO Checklist
Complete checklist for optimizing web pages covering title tags, meta descriptions, headings, image alt text, internal links, and Core Web Vitals
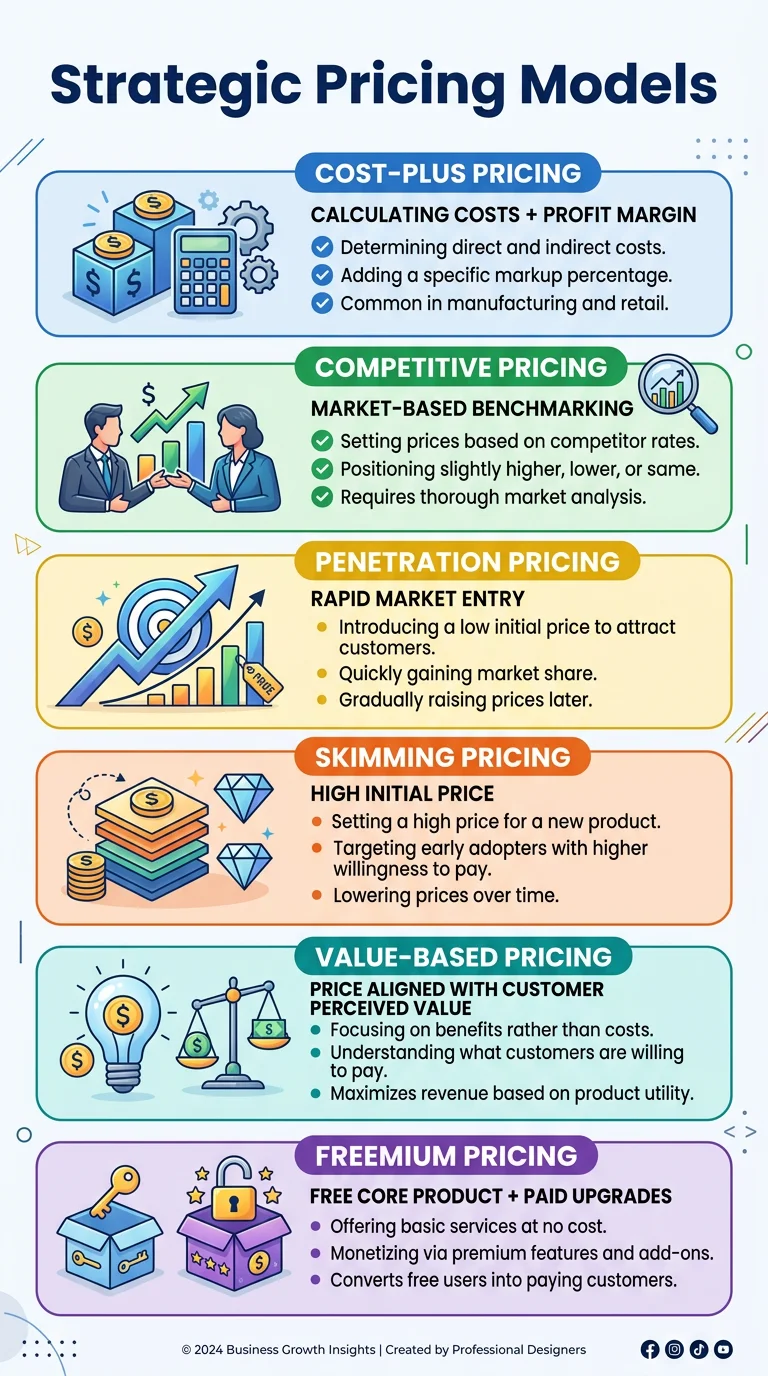
Pricing Strategy Models
Comparison of 6 common pricing strategies including cost-plus, value-based, competitive, freemium, penetration, and skimming with when to use each
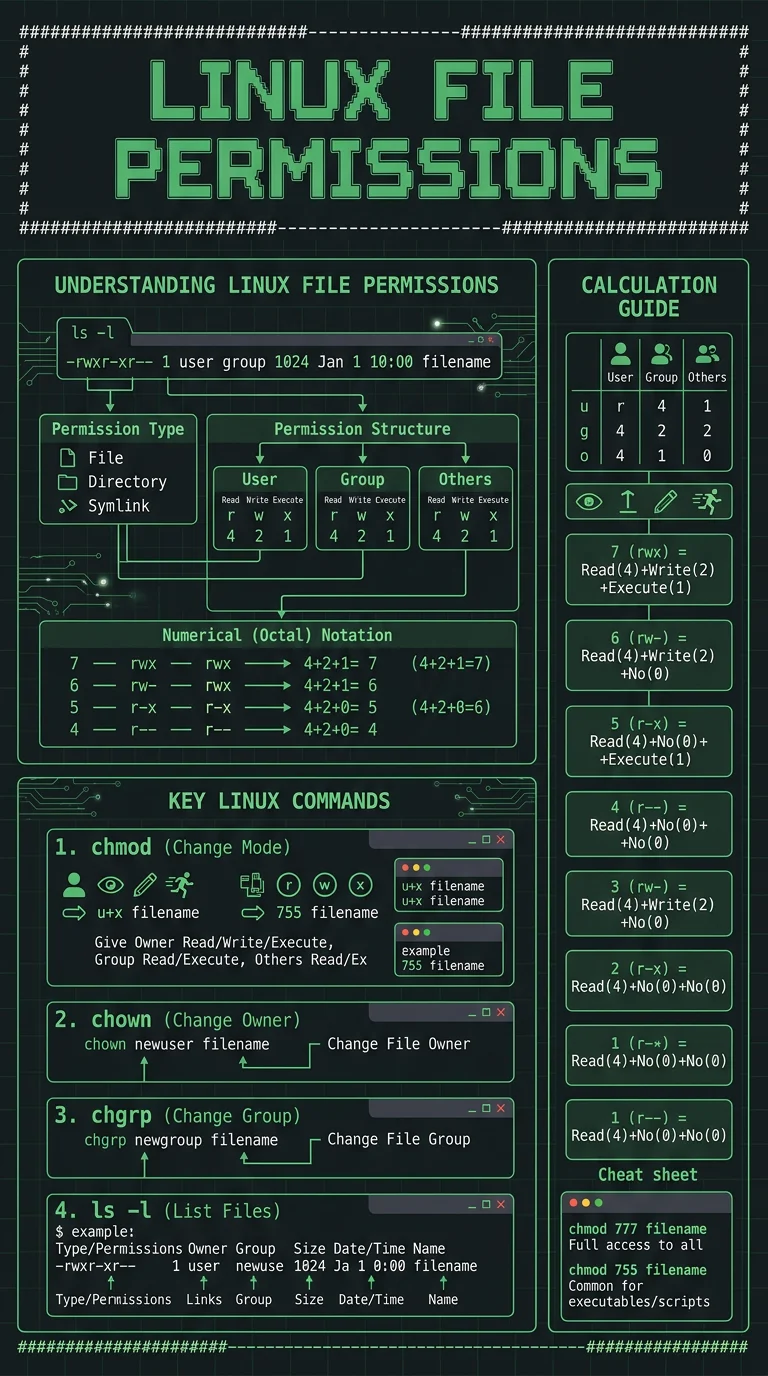
Linux File Permissions Explained
Visual guide to Unix file permissions showing rwx notation, octal codes, chmod commands, and ownership with real examples for common scenarios
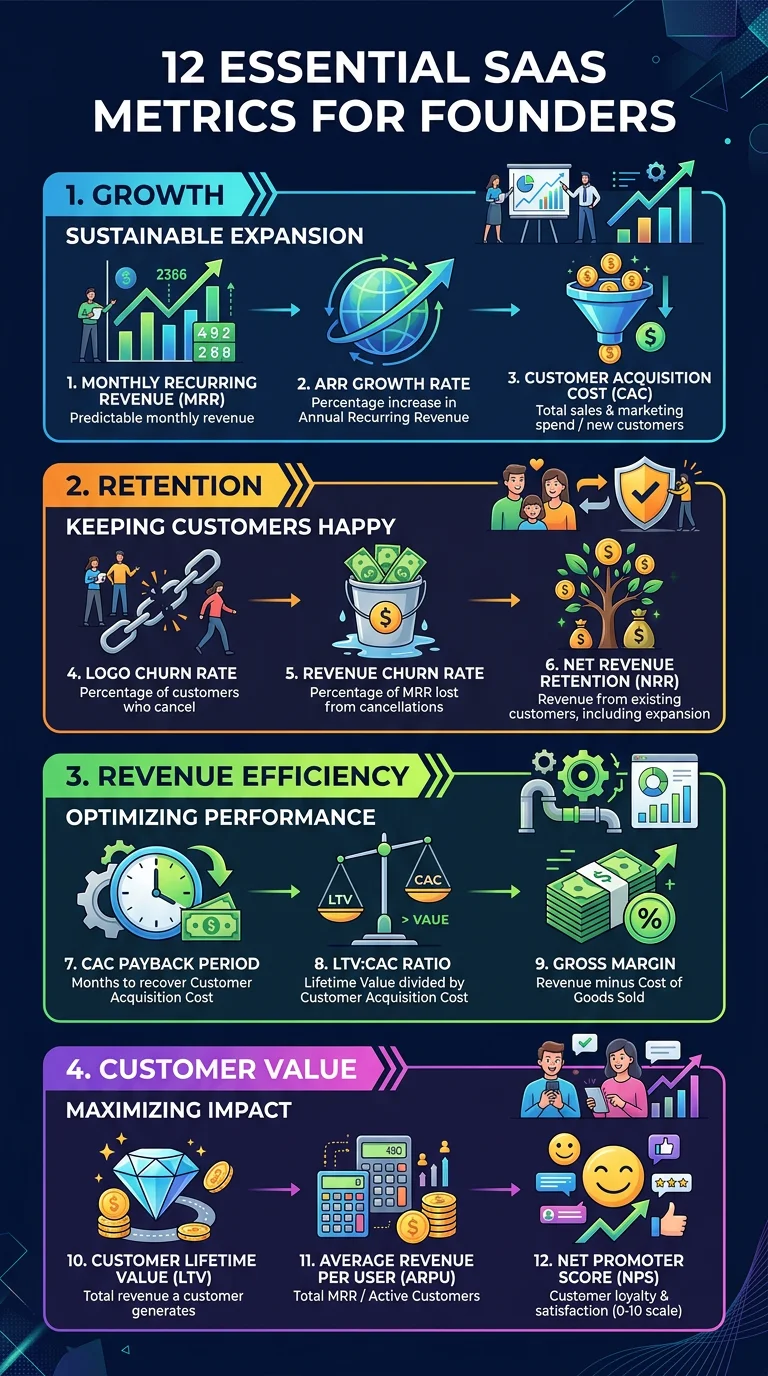
SaaS Metrics That Actually Matter
The 12 key SaaS metrics every founder should track including MRR, ARR, churn, LTV, CAC, burn rate, and runway with formulas and healthy benchmarks
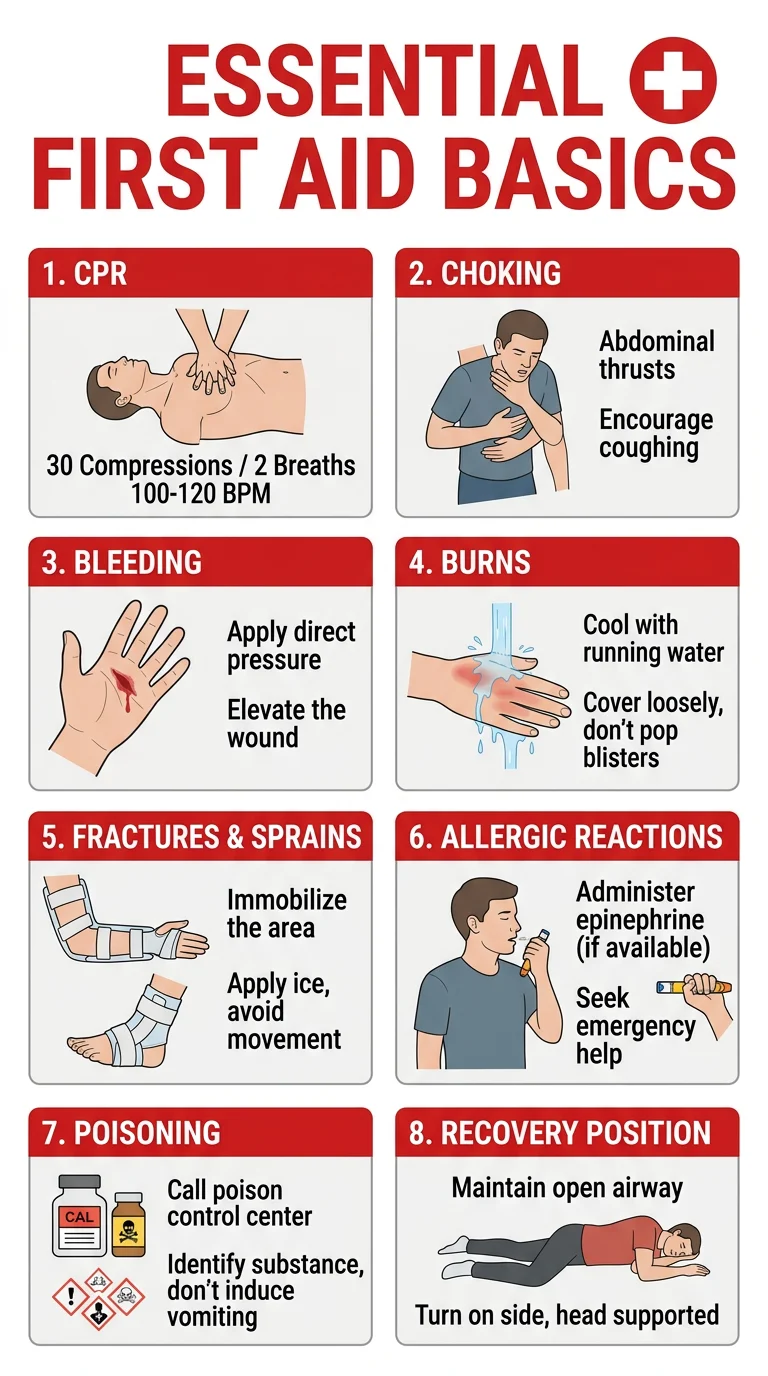
First Aid Basics Quick Reference
Essential first aid procedures for the 8 most common emergencies including CPR steps, choking response, burn treatment, and when to call 911
Core infographic formats
These are the main ways infographics tend to be structured once you know the format that fits the story.
Comparison Infographics
Side-by-side analysis of options, features, or competitors
Timeline Infographics
Chronological sequences of events, milestones, or history
Statistical Infographics
Data-driven visuals with charts, numbers, and key metrics
Social Media Infographics
Shareable graphics optimized for social platforms
Presentation Infographics
Slide-ready visuals for pitches, talks, and meetings
Process Infographics
Step-by-step workflows, guides, and procedural breakdowns