All Categories
Technology Infographics
Technology infographics are useful when you need to explain systems, tradeoffs, or change over time without turning the page into dense documentation. The strongest examples simplify concepts while keeping the logic intact.
Common patterns in this category
- Framework and tooling comparisons
- Architecture or workflow explainers
- Roadmaps and adoption timelines
Best infographic types
Selected examples
Guided starters that fit this category especially well.
Technology
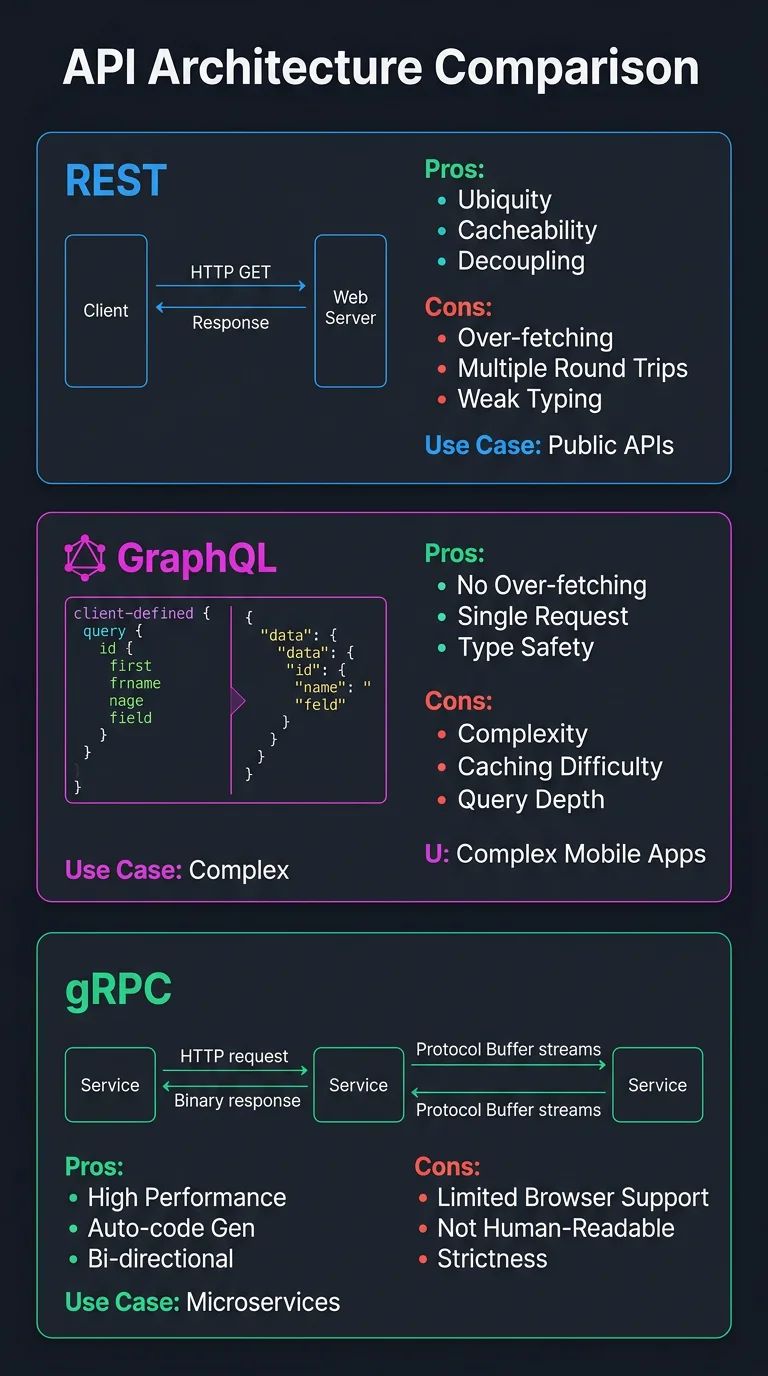
API Architecture Patterns Compared
Side-by-side comparison of REST, GraphQL, gRPC, and WebSocket APIs with use cases, pros and cons, and a decision guide
Technology
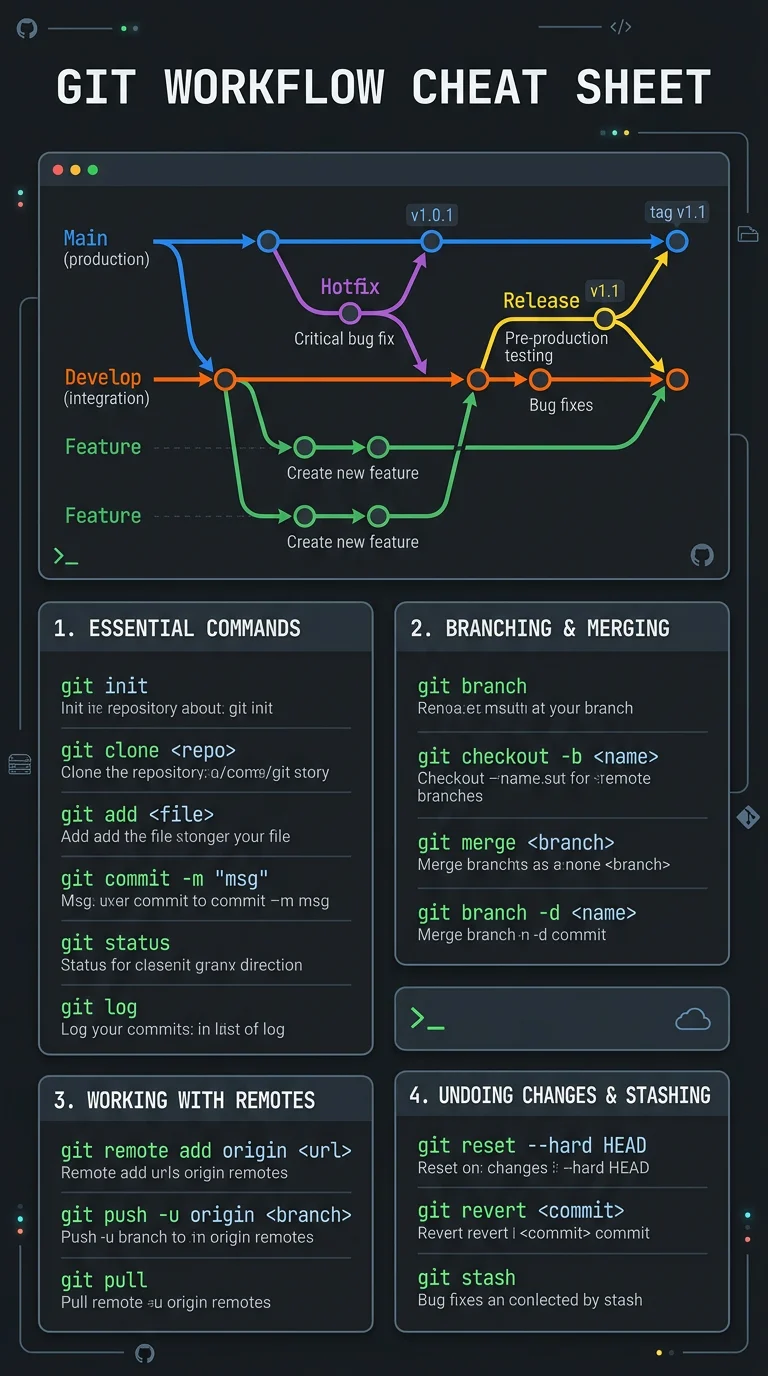
Git Workflow Cheat Sheet
Visual guide to Git branching strategies showing feature branches, pull requests, merge vs rebase, and common commands with examples
Technology
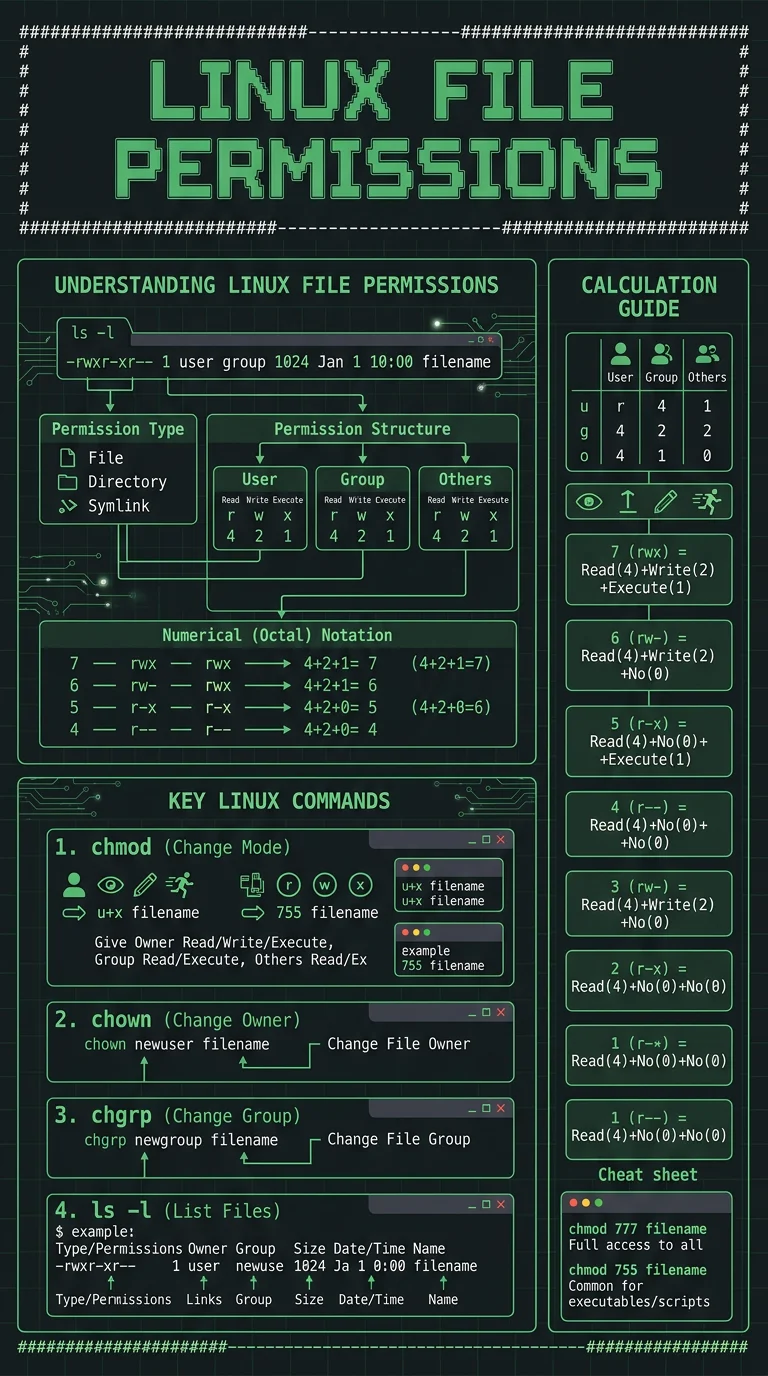
Linux File Permissions Explained
Visual guide to Unix file permissions showing rwx notation, octal codes, chmod commands, and ownership with real examples for common scenarios