All Categories
Startup Infographics
Startup infographics are usually about momentum: what changed, why it matters, and how to present that clearly to investors, customers, or the team. This category tends to overlap with growth, fundraising, and milestone storytelling.
Common patterns in this category
- Fundraising and traction snapshots
- Company or product milestone timelines
- Pitch-deck-ready market and growth visuals
Best infographic types
Selected examples
Guided starters that fit this category especially well.
Startup
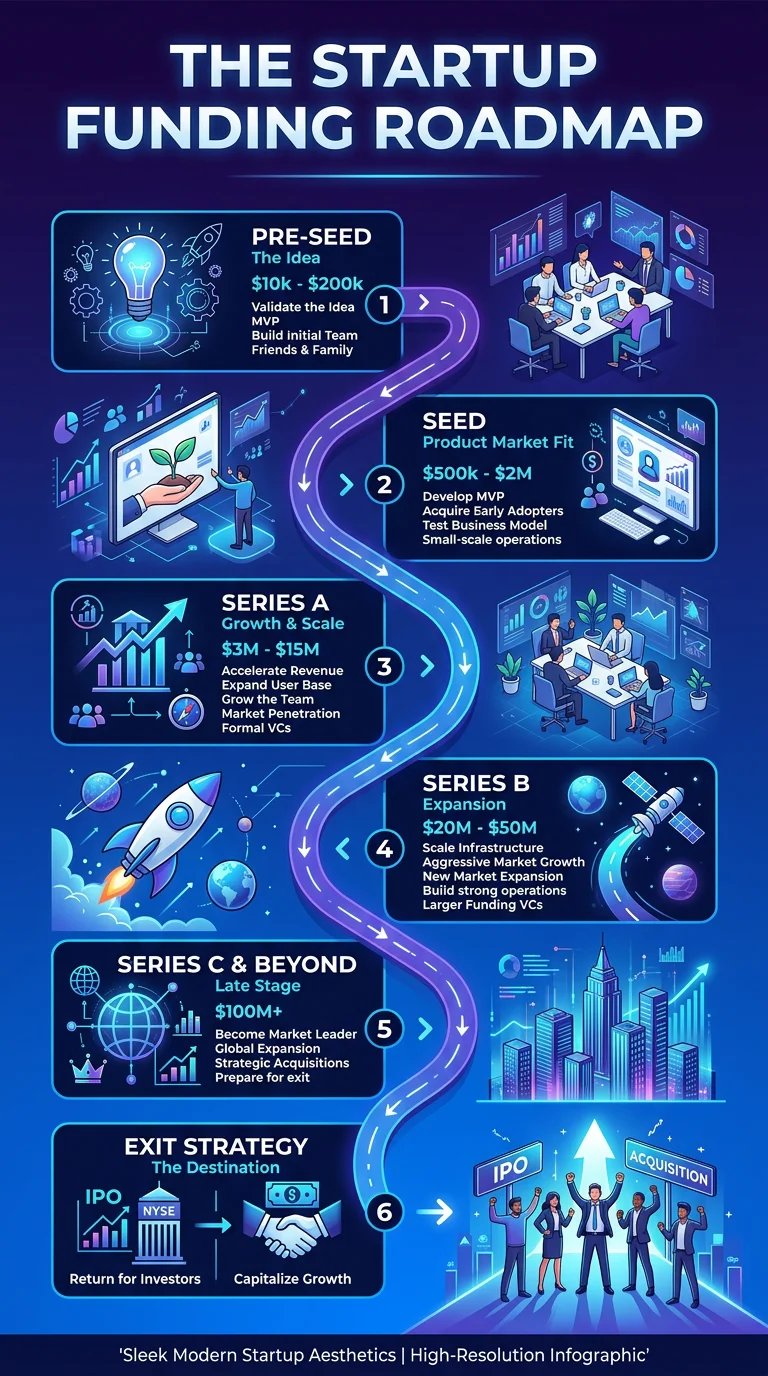
Startup Funding Stages Explained
Visual roadmap from pre-seed to IPO showing typical funding amounts, equity dilution, investor types, and milestones expected at each stage
Startup
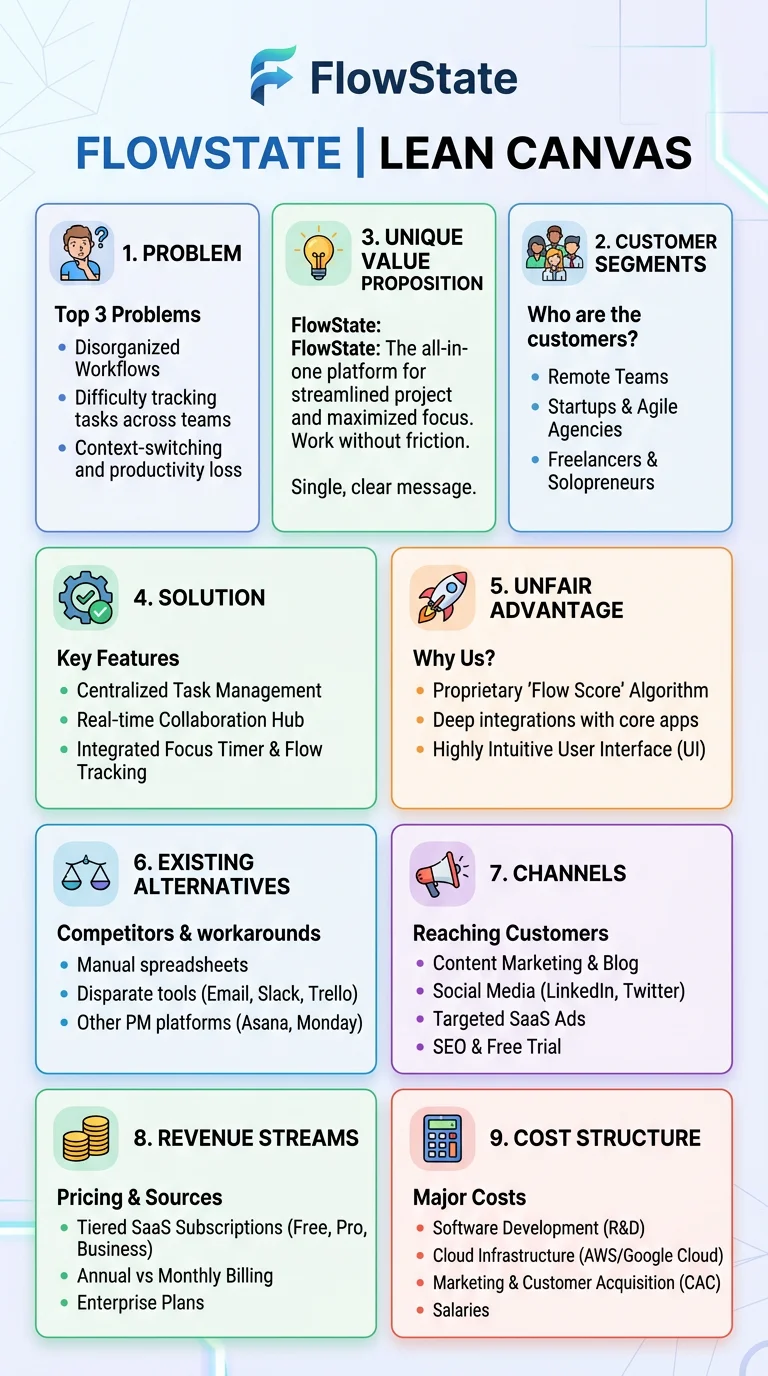
Lean Canvas One-Pager
Visual template of the Lean Canvas framework with all 9 blocks explained including problem, solution, key metrics, unfair advantage, and revenue streams
Startup
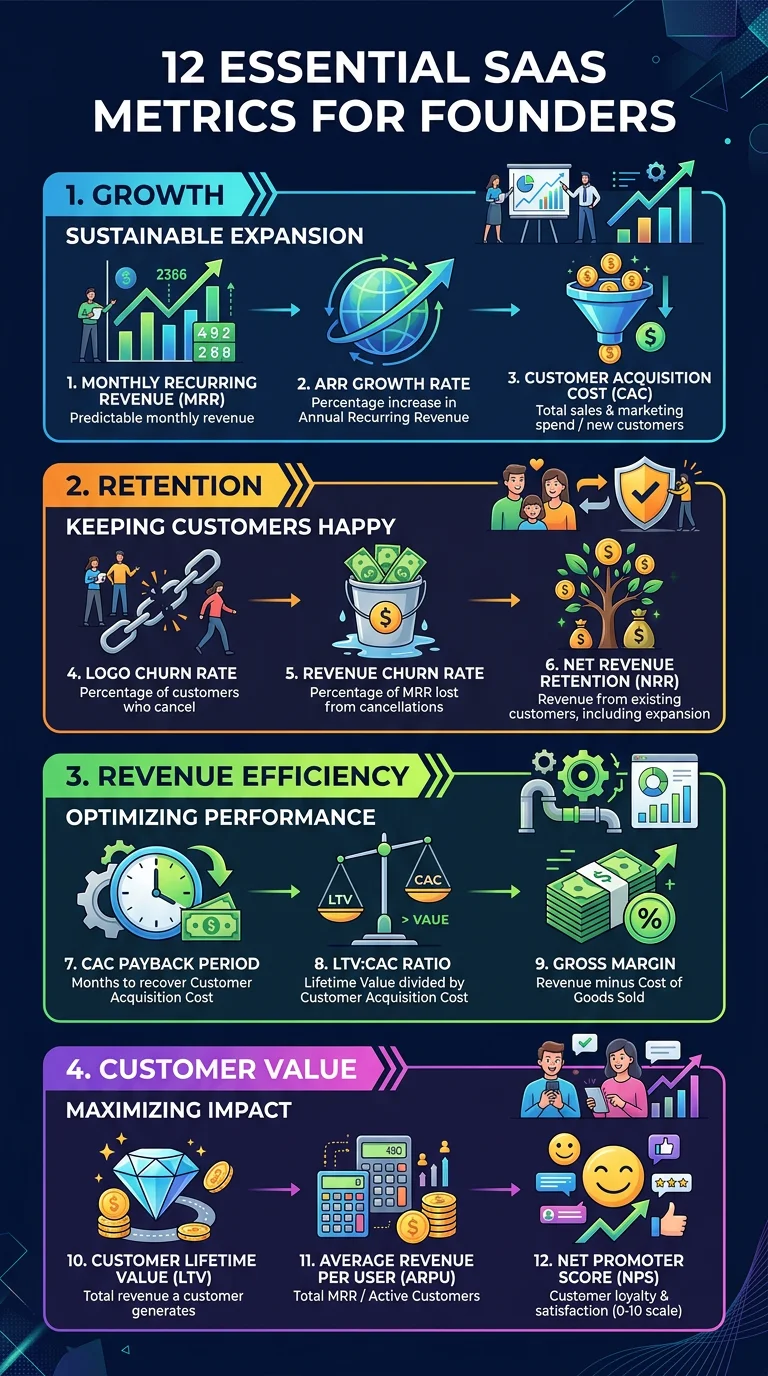
SaaS Metrics That Actually Matter
The 12 key SaaS metrics every founder should track including MRR, ARR, churn, LTV, CAC, burn rate, and runway with formulas and healthy benchmarks