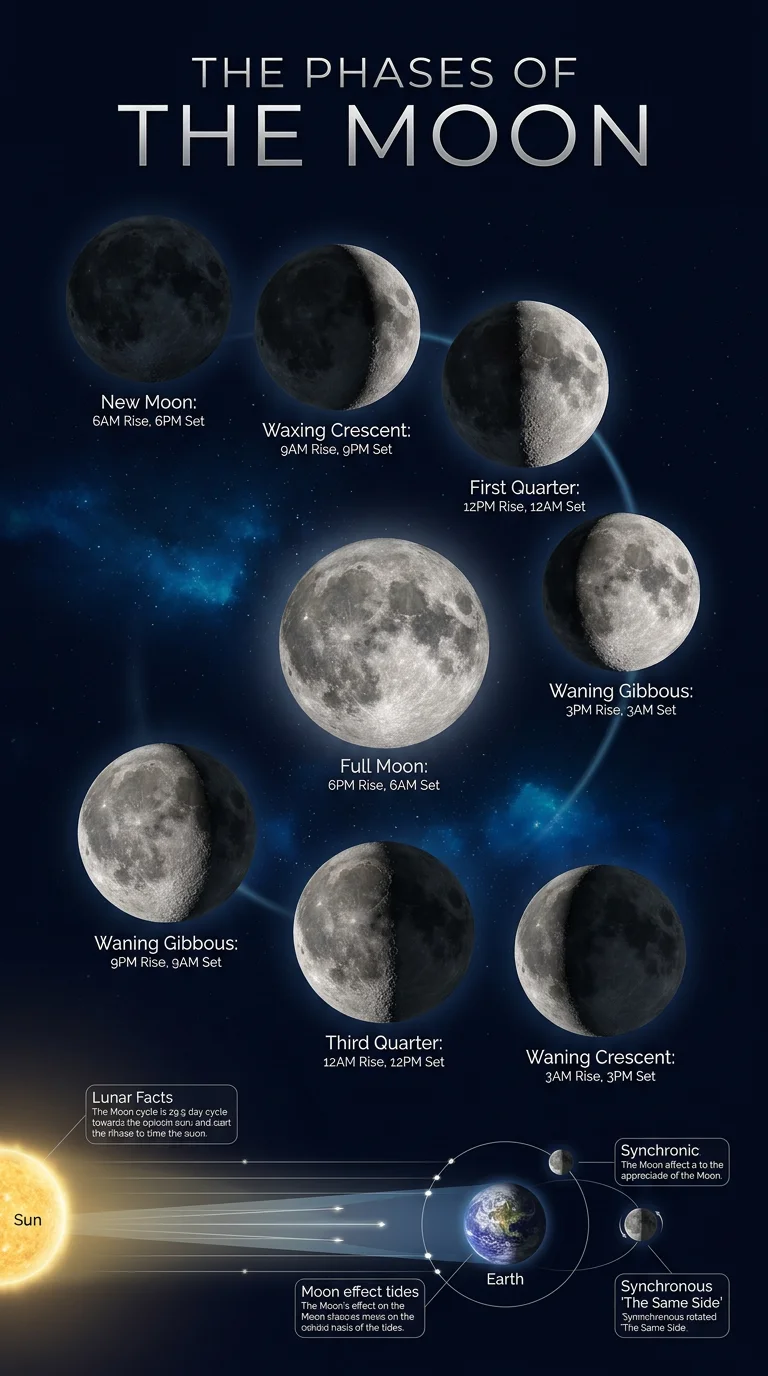
Moon Phases Explained
Visual timeline of the 8 lunar phases over a month showing waxing and waning stages with illumination percentages, rise and set times, and key astronomy facts
About this example
Visual timeline of the 8 lunar phases over a month showing waxing and waning stages with illumination percentages, rise and set times, and key astronomy facts
Prompt Preview
Create an educational infographic explaining the phases of the Moon. Show all 8 phases in order across a monthly timeline: New Moon, Waxing Crescent, First Quarter, Waxing Gibbous, Full Moon, Waning Gibbous, Third Quarter, and Waning Crescent. For each phase show a realistic illustration of how the Moon looks, the illumination percentage, and approximate rise and set times. Include a diagram showing the Sun-Earth-Moon positions that cause the phases. Add fun facts about lunar cycles, tides, and why we always see the same side. Use a deep space dark background with silver, white, and subtle blue tones.
More Education Examples
View all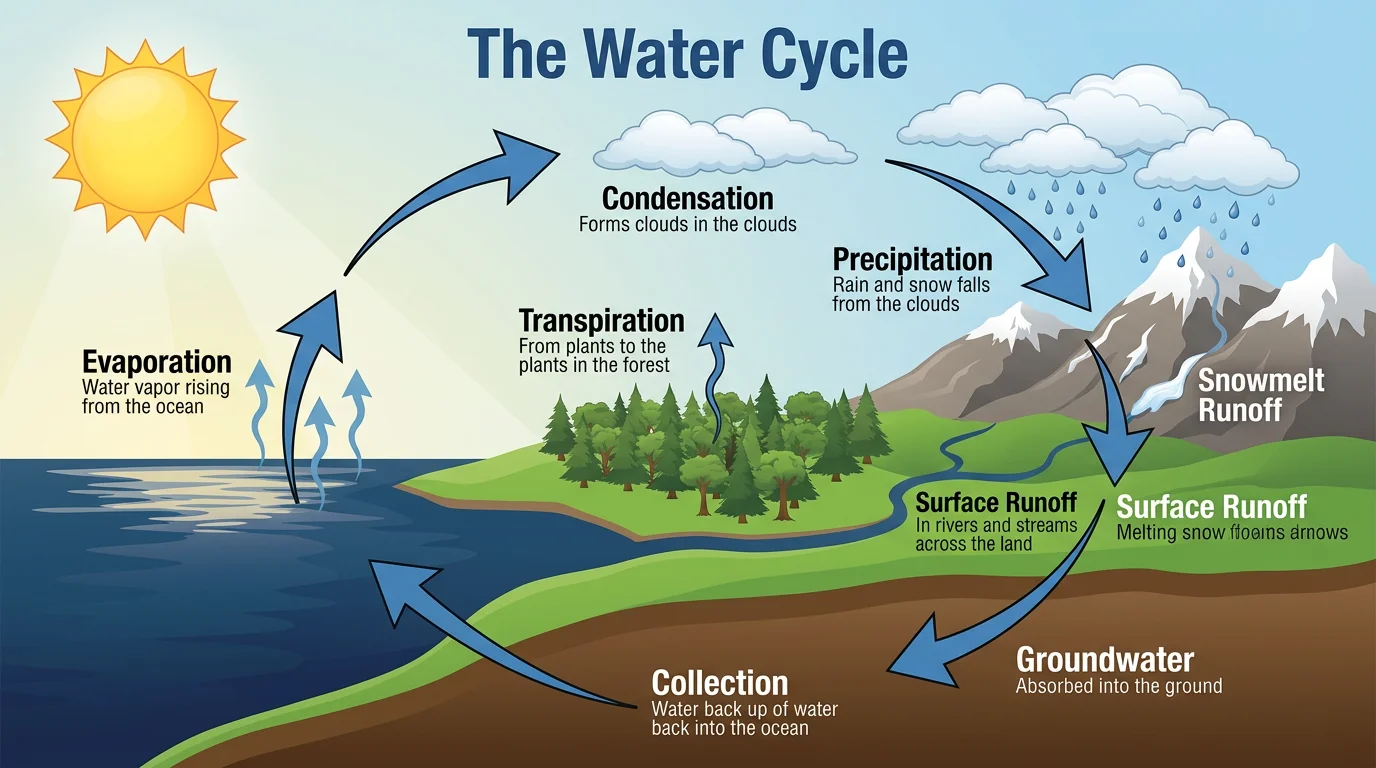
The Water Cycle Explained
Complete visual guide to Earth's water cycle showing evaporation, condensation, precipitation, runoff, and collection with key freshwater facts
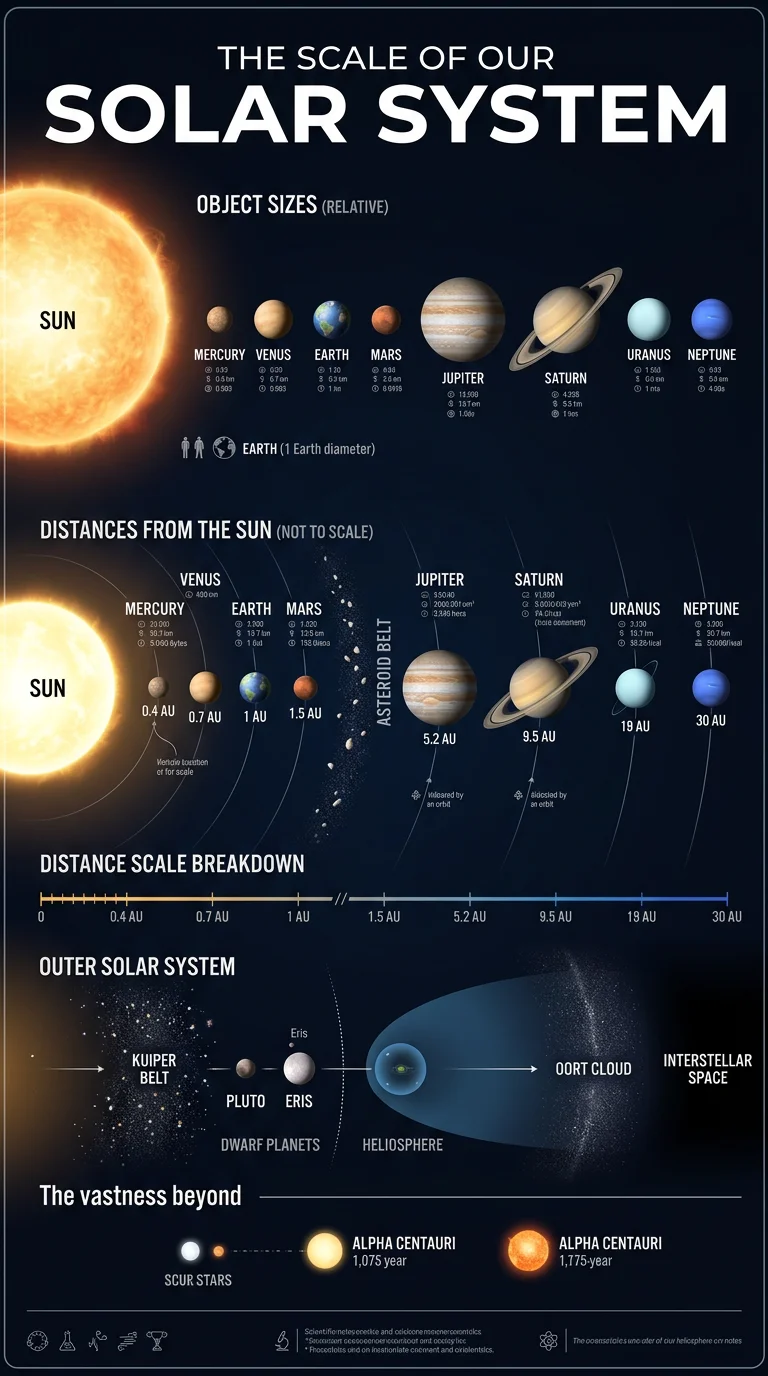
Solar System Scale Cheat Sheet
All 8 planets with relative sizes, distances, orbital periods, fun facts, and size comparisons between Earth, Jupiter, and the Sun
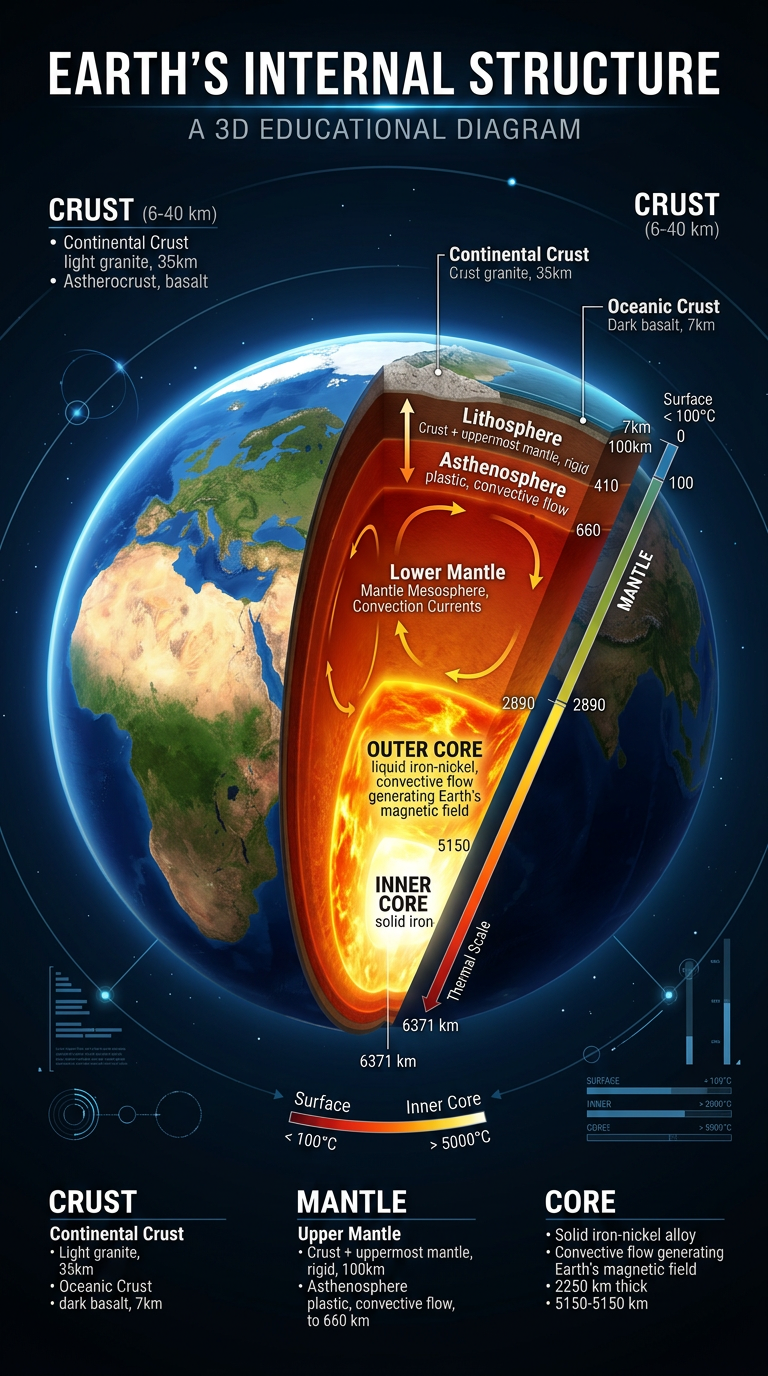
Layers of the Earth
Cross-section diagram showing Earth's crust, mantle, outer core, and inner core with thickness, temperature, composition, and state of matter for each layer
Want to customize further?
Use this example as a base, then tweak the prompt, upload your own data, or add reference images for a fully custom result.
Generate from This Example