SaaS Metrics That Actually Matter
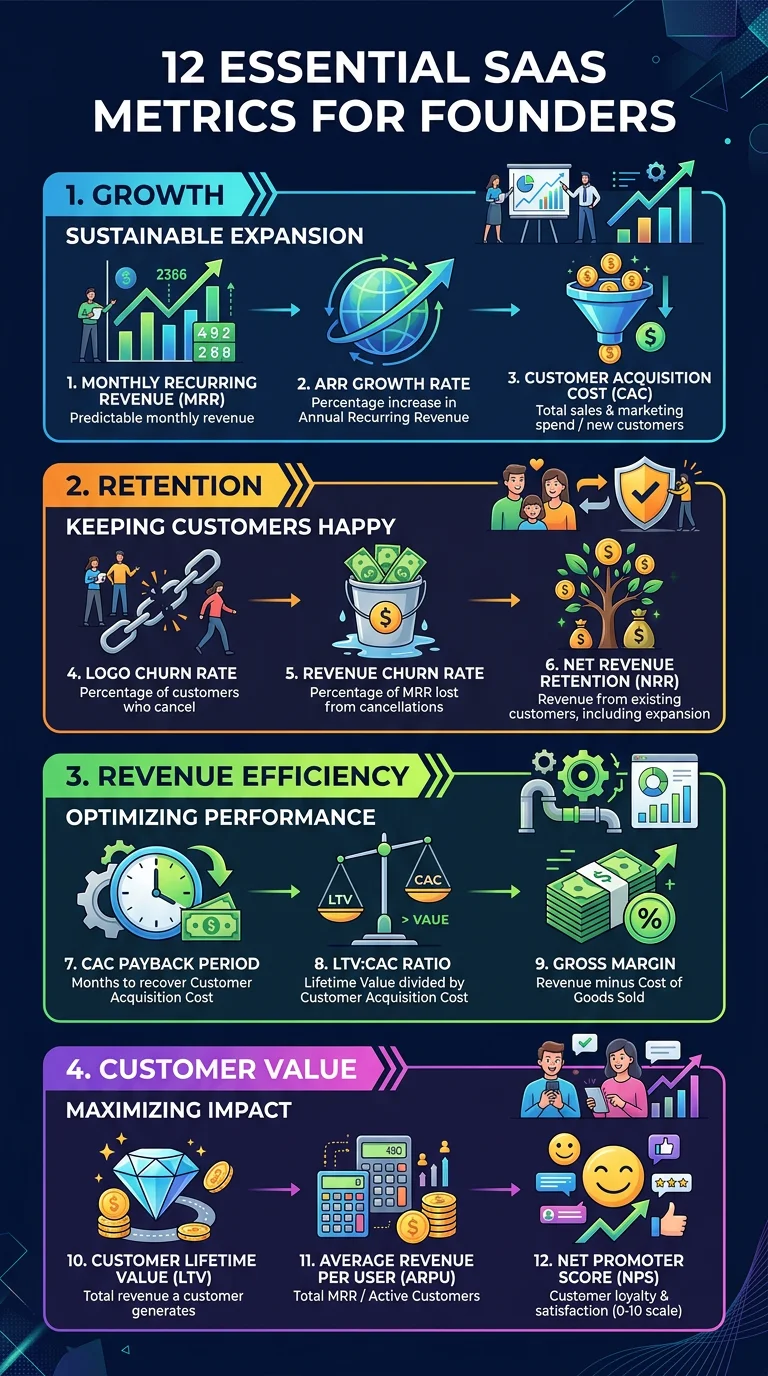
The 12 key SaaS metrics every founder should track including MRR, ARR, churn, LTV, CAC, burn rate, and runway with formulas and healthy benchmarks
About this example
The 12 key SaaS metrics every founder should track including MRR, ARR, churn, LTV, CAC, burn rate, and runway with formulas and healthy benchmarks
Prompt Preview
Create a startup infographic showing the 12 essential SaaS metrics every founder needs to track. For each metric show the formula, a healthy benchmark range, and a one-line explanation of why it matters. Include: Monthly Recurring Revenue (MRR), Annual Recurring Revenue (ARR), MRR Growth Rate, Gross Churn Rate, Net Revenue Retention, Customer Acquisition Cost (CAC), Lifetime Value (LTV), LTV to CAC Ratio, Payback Period, Burn Rate, Runway, and Magic Number. Group them into Growth Metrics, Retention Metrics, Unit Economics, and Cash Metrics. Use color coding to show green for healthy ranges and red for danger zones. Use a clean modern design with a dark navy background, white text, and vibrant accent colors for each metric group.
More Startup Examples
View all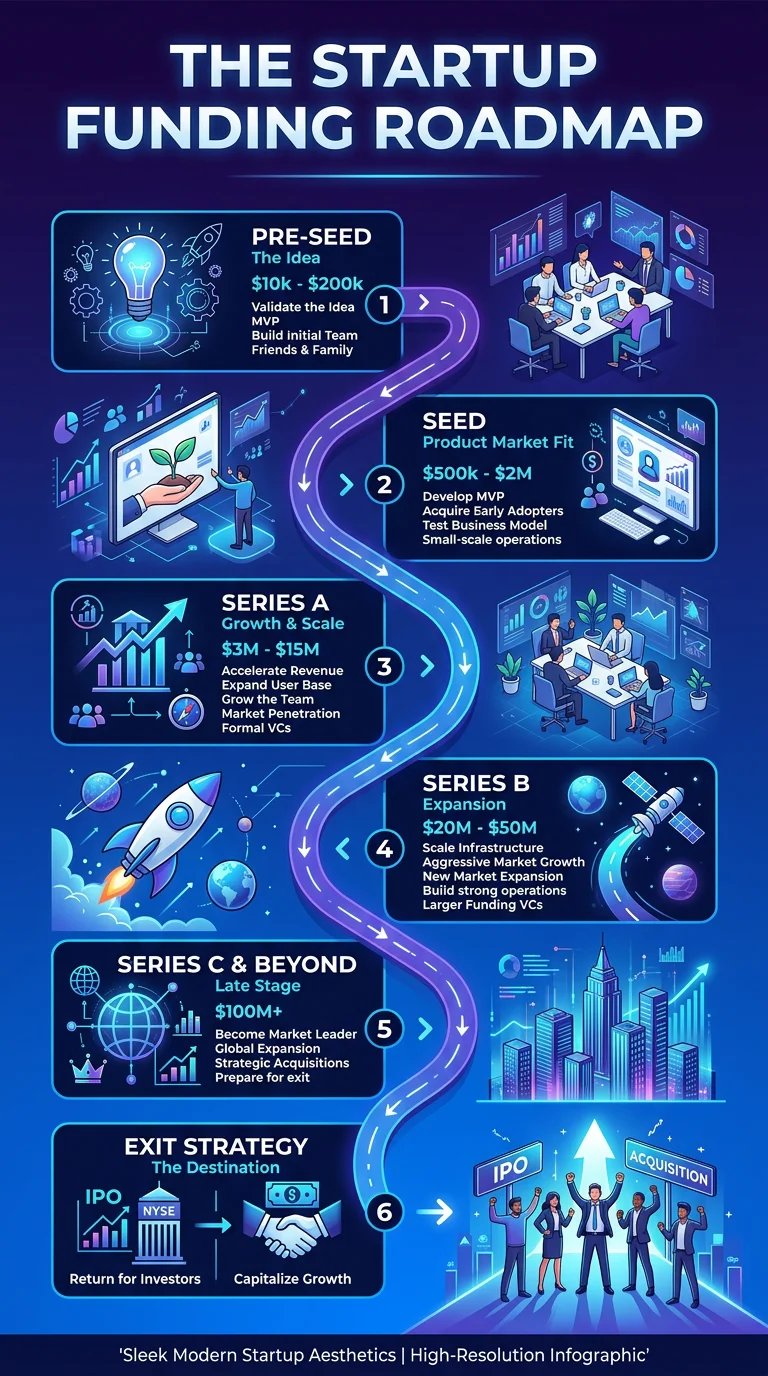
Startup Funding Stages Explained
Visual roadmap from pre-seed to IPO showing typical funding amounts, equity dilution, investor types, and milestones expected at each stage
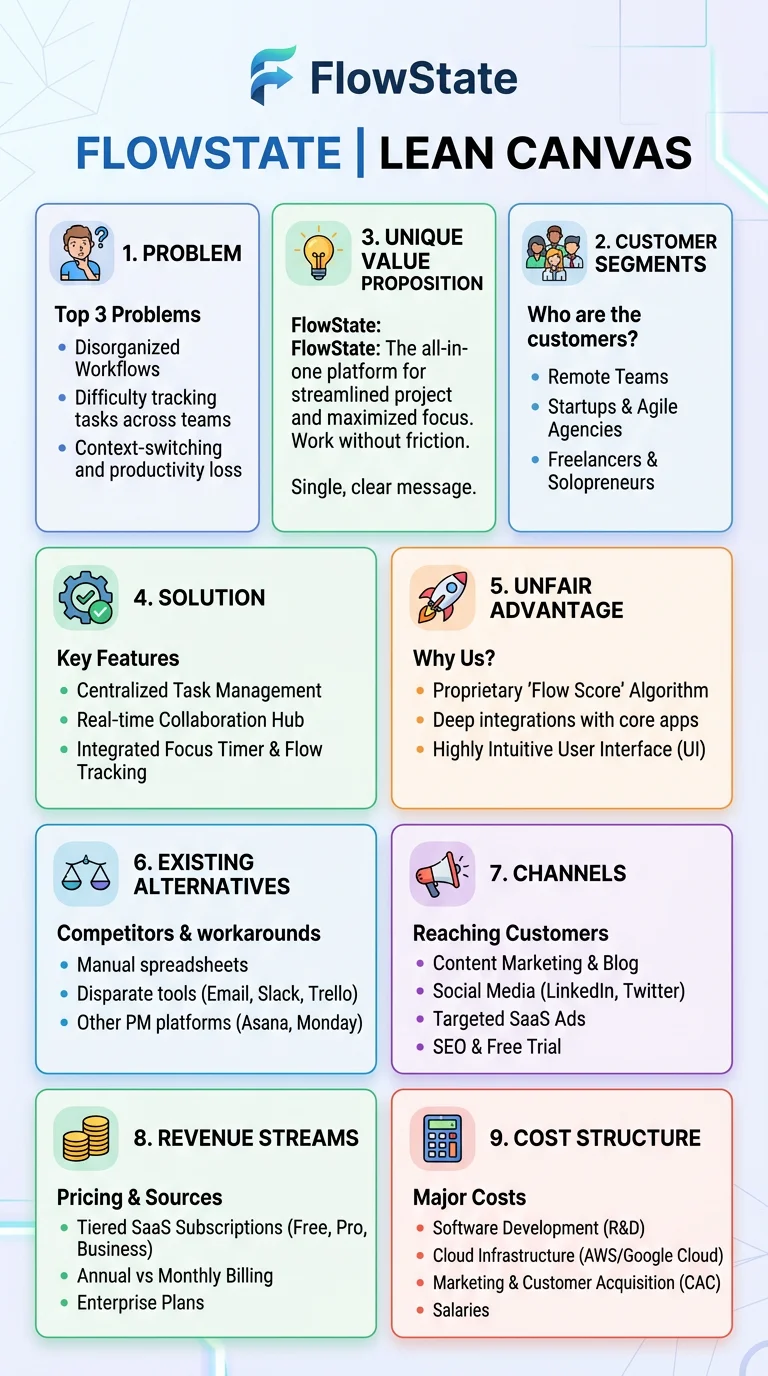
Lean Canvas One-Pager
Visual template of the Lean Canvas framework with all 9 blocks explained including problem, solution, key metrics, unfair advantage, and revenue streams
Want to customize further?
Use this example as a base, then tweak the prompt, upload your own data, or add reference images for a fully custom result.
Generate from This Example