Startup Funding Stages Explained
Visual roadmap from pre-seed to IPO showing typical funding amounts, equity dilution, investor types, and milestones expected at each stage

About this example
Visual roadmap from pre-seed to IPO showing typical funding amounts, equity dilution, investor types, and milestones expected at each stage
Prompt Preview
Create a startup infographic explaining the stages of startup funding. Show a visual roadmap from left to right or top to bottom covering Pre-Seed, Seed, Series A, Series B, Series C, and IPO. For each stage include typical funding amount range, equity dilution percentage, main investor types (angels, VCs, growth equity), company valuation range, and key milestones expected before raising that round. Include a timeline showing how long each stage typically takes. Add a small section on alternative funding like bootstrapping, grants, and revenue-based financing. Use a bold modern startup design with a gradient from deep purple to electric blue, clean white text, and accent colors for each stage.
More Startup Examples
View all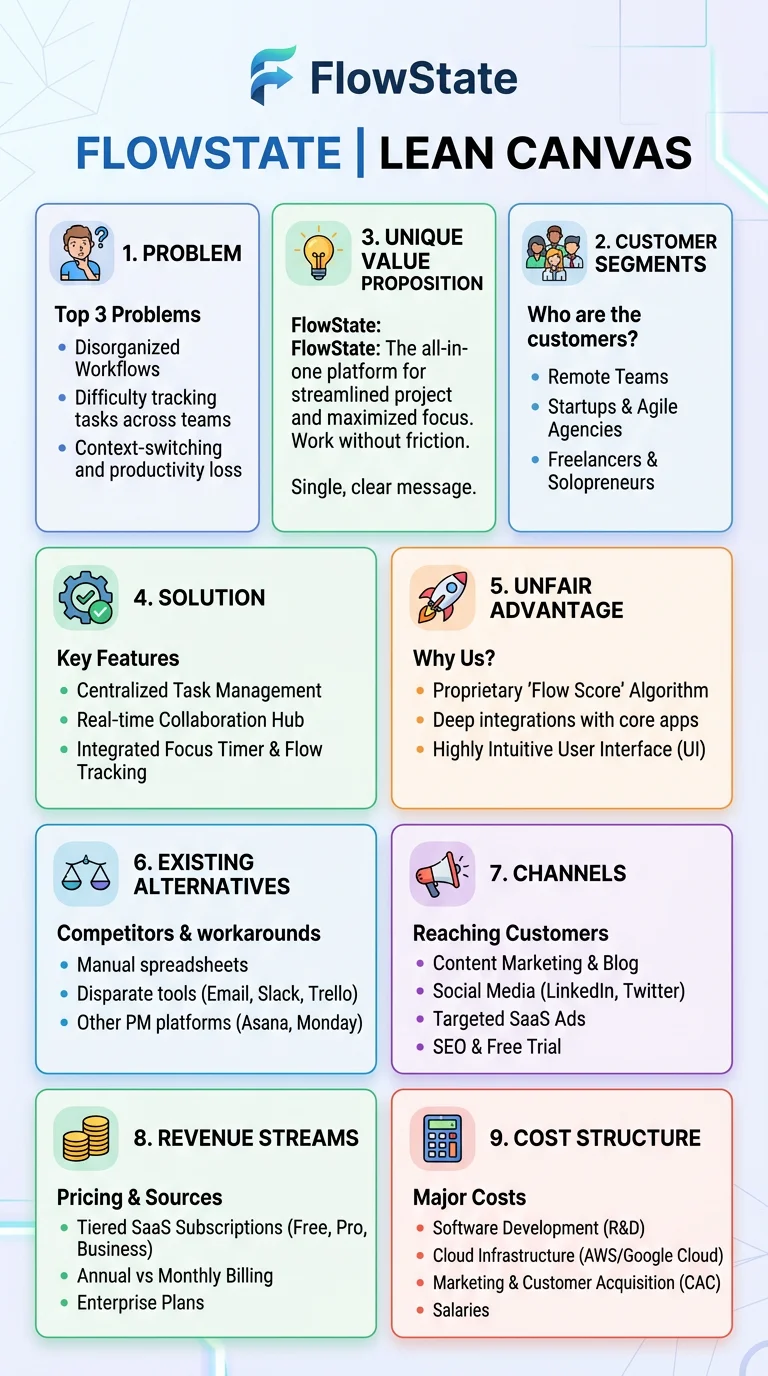
Lean Canvas One-Pager
Visual template of the Lean Canvas framework with all 9 blocks explained including problem, solution, key metrics, unfair advantage, and revenue streams
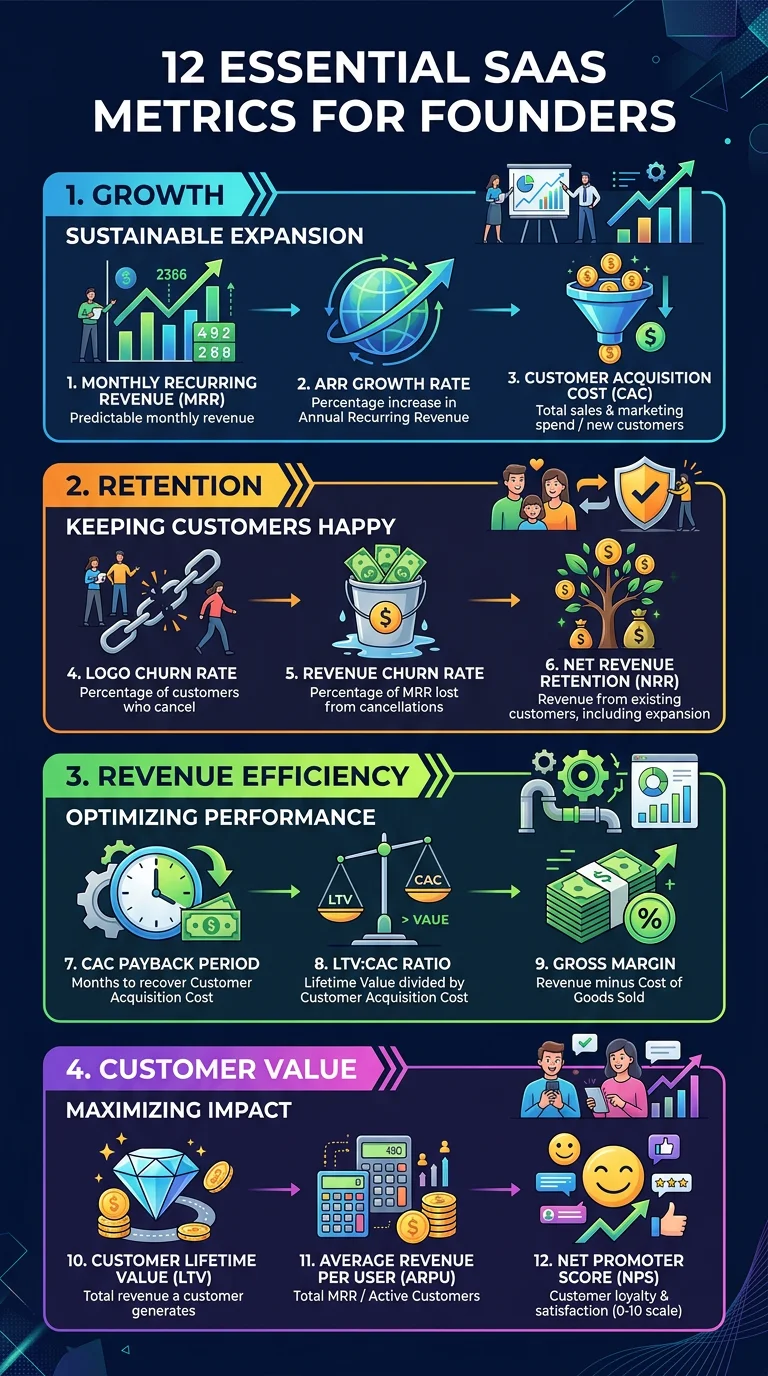
SaaS Metrics That Actually Matter
The 12 key SaaS metrics every founder should track including MRR, ARR, churn, LTV, CAC, burn rate, and runway with formulas and healthy benchmarks
Want to customize further?
Use this example as a base, then tweak the prompt, upload your own data, or add reference images for a fully custom result.
Generate from This Example